Moving to Renton, Washington
About Renton, Washington

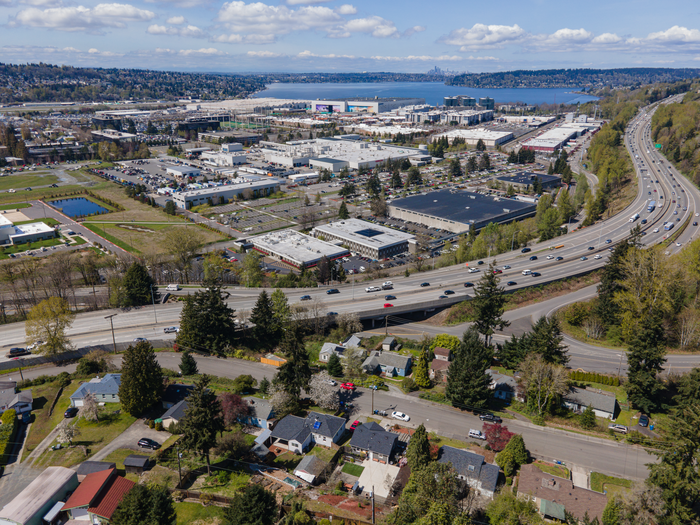
Renton is a city in King County, Washington, United States, and an inner-ring suburb of Seattle. Situated 11 miles (18 km) southeast of downtown Seattle, Renton straddles the southeast shore of Lake Washington, at the mouth of the Cedar River. As of the 2020 census, the population of Renton was 106,785, up from 90,927 at the 2010 census. The city is currently the 6th most populous municipality in greater Seattle and the 8th most populous city in Washington.
After a long history as an important salmon fishing area for Native Americans, Renton was first settled by people of European descent in the 1860s. Its early economy was based on coal mining, clay production, and timber export. Today, Renton is best known as the final assembly point for the Boeing 737 family of commercial airplanes, but it is also home to a growing number of well-known manufacturing, technology, and healthcare organizations, including Boeing Commercial Airplanes Division, Paccar, Kaiser Permanente, Providence Health & Services, UW Medicine, and Wizards of the Coast.
Gender
| Gender | Renton | Washington | Country |
|---|---|---|---|
| Female | 49.8% | 50% | 50.8% |
| Male | 50.2% | 50% | 49.2% |
Gender
Household Income
| Income | Renton | Washington | Country |
|---|---|---|---|
| Less than $10,000 | 3.5% | 4.4% | 5.8% |
| $10,000 to $14,999 | 2.5% | 3.1% | 4.1% |
| $15,000 to $24,999 | 5.9% | 6.5% | 8.5% |
| $25,000 to $34,999 | 5.5% | 6.9% | 8.6% |
| $35,000 to $49,999 | 9.6% | 10.8% | 12.0% |
| $50,000 to $74,999 | 19.7% | 17.1% | 17.2% |
| $75,000 to $99,999 | 14.2% | 13.6% | 12.8% |
| $100,000 to $149,999 | 19.1% | 18.2% | 15.6% |
| $150,000 to $199,999 | 10.3% | 8.9% | 7.1% |
| $200,000 or more | 9.7% | 10.5% | 8.3% |
Education
| Education | Renton | Washington | Country |
|---|---|---|---|
| < 9th Grade | 5% | 3% | 5.0% |
| 9-12th Grade | 4% | 5% | 7.0% |
| High School or GED | 24% | 22% | 27.0% |
| Other College | 21% | 23% | 20.0% |
| Associate's Degree | 11% | 10% | 9% |
| Bachelor's Degree | 24% | 23% | 20.0% |
| Master's Degree | 9% | 10% | 9.0% |
| Professional Degree | 1% | 2% | 2.0% |
| Doctorate Degree | 1% | 2% | 1.0% |
Household Income
Education
Race / Ethnicity
| Ethnicity | Renton | Washington | Country |
|---|---|---|---|
| White | 44.2% | 67.5% | 60.1% |
| African American | 8.7% | 3.7% | 12.2% |
| American Indian | 0.5% | 1% | 0.6% |
| Asian | 23.8% | 8.7% | 5.6% |
| Hawaiian | 1.2% | 0.7% | 0.2% |
| Other | 0.6% | 0.3% | 0.3% |
| Multiracial | 6.2% | 5.2% | 2.8% |
| Hispanic | 14.8% | 12.9% | 18.2% |
Race / Ethnicity
- ALABAMA
- ALASKA
- ARIZONA
- ARKANSAS
- CALIFORNIA
- COLORADO
- CONNECTICUT
- DELAWARE
- FLORIDA
- GEORGIA
- HAWAII
- IDAHO
- ILLINOIS
- INDIANA
- IOWA
- KANSAS
- KENTUCKY
- LOUISIANA
- MAINE
- MARYLAND
- MASSACHUSETTS
- MICHIGAN
- MINNESOTA
- MISSISSIPPI
- MISSOURI
- MONTANA
- NEBRASKA
- NEVADA
- NEW HAMPSHIRE
- NEW JERSEY
- NEW MEXICO
- NEW YORK
- NORTH CAROLINA
- NORTH DAKOTA
- OHIO
- OKLAHOMA
- OREGON
- PENNSYLVANIA
- RHODE ISLAND
- SOUTH CAROLINA
- SOUTH DAKOTA
- TENNESSEE
- TEXAS
- UTAH
- VERMONT
- VIRGINIA
- WASHINGTON
- WEST VIRGINIA
- WISCONSIN
- WYOMING
