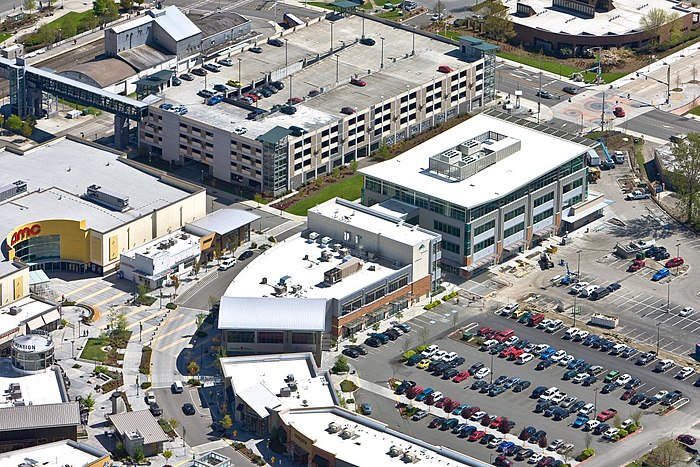
Moving to Kent, Washington
About Kent, Washington

Kent is a city in King County, Washington, United States. It is part of the Seattle–Tacoma–Bellevue metropolitan area and had a population of 136,588 as of the 2020 census, making it the 4th most populous municipality in greater Seattle and the 6th most populous in Washington state. The city is connected to Seattle, Bellevue and Tacoma via State Route 167 and Interstate 5, Sounder commuter rail, and commuter buses.
Incorporated in 1890, Kent is the second-oldest incorporated city in the county, after the county seat of Seattle. It is generally divided into three areas: West Hill (mixed residential and commercial along Interstate 5), Valley (primarily industrial and commercial with some medium-density residential; significant parkland along Green River), and East Hill (primarily residential with retail).
Gender
| Gender | Kent | Washington | Country |
|---|---|---|---|
| Female | 49.2% | 50% | 50.8% |
| Male | 50.8% | 50% | 49.2% |
Gender
Household Income
| Income | Kent | Washington | Country |
|---|---|---|---|
| Less than $10,000 | 3.9% | 4.4% | 5.8% |
| $10,000 to $14,999 | 2.4% | 3.1% | 4.1% |
| $15,000 to $24,999 | 6.9% | 6.5% | 8.5% |
| $25,000 to $34,999 | 6.7% | 6.9% | 8.6% |
| $35,000 to $49,999 | 11.4% | 10.8% | 12.0% |
| $50,000 to $74,999 | 19.5% | 17.1% | 17.2% |
| $75,000 to $99,999 | 14% | 13.6% | 12.8% |
| $100,000 to $149,999 | 19.1% | 18.2% | 15.6% |
| $150,000 to $199,999 | 9% | 8.9% | 7.1% |
| $200,000 or more | 7.1% | 10.5% | 8.3% |
Education
| Education | Kent | Washington | Country |
|---|---|---|---|
| < 9th Grade | 6% | 3% | 5.0% |
| 9-12th Grade | 7% | 5% | 7.0% |
| High School or GED | 26% | 22% | 27.0% |
| Other College | 23% | 23% | 20.0% |
| Associate's Degree | 11% | 10% | 9% |
| Bachelor's Degree | 20% | 23% | 20.0% |
| Master's Degree | 6% | 10% | 9.0% |
| Professional Degree | 1% | 2% | 2.0% |
| Doctorate Degree | 0% | 2% | 1.0% |
Household Income
Education
Race / Ethnicity
| Ethnicity | Kent | Washington | Country |
|---|---|---|---|
| White | 41.5% | 67.5% | 60.1% |
| African American | 11.7% | 3.7% | 12.2% |
| American Indian | 0.4% | 1% | 0.6% |
| Asian | 21.6% | 8.7% | 5.6% |
| Hawaiian | 2.1% | 0.7% | 0.2% |
| Other | 0.3% | 0.3% | 0.3% |
| Multiracial | 6.4% | 5.2% | 2.8% |
| Hispanic | 16% | 12.9% | 18.2% |
Race / Ethnicity
- ALABAMA
- ALASKA
- ARIZONA
- ARKANSAS
- CALIFORNIA
- COLORADO
- CONNECTICUT
- DELAWARE
- FLORIDA
- GEORGIA
- HAWAII
- IDAHO
- ILLINOIS
- INDIANA
- IOWA
- KANSAS
- KENTUCKY
- LOUISIANA
- MAINE
- MARYLAND
- MASSACHUSETTS
- MICHIGAN
- MINNESOTA
- MISSISSIPPI
- MISSOURI
- MONTANA
- NEBRASKA
- NEVADA
- NEW HAMPSHIRE
- NEW JERSEY
- NEW MEXICO
- NEW YORK
- NORTH CAROLINA
- NORTH DAKOTA
- OHIO
- OKLAHOMA
- OREGON
- PENNSYLVANIA
- RHODE ISLAND
- SOUTH CAROLINA
- SOUTH DAKOTA
- TENNESSEE
- TEXAS
- UTAH
- VERMONT
- VIRGINIA
- WASHINGTON
- WEST VIRGINIA
- WISCONSIN
- WYOMING
