Moving to Reston, Virginia
About Reston, Virginia

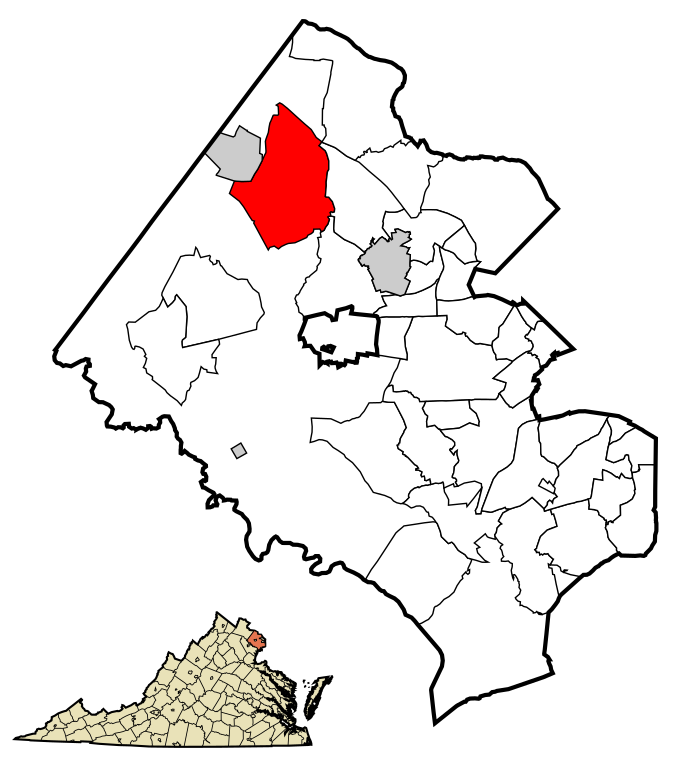
Reston is a census-designated place in Fairfax County, Virginia, United States, and a principal city of both Northern Virginia and the Washington metropolitan area. As of the 2020 U.S. census, Reston's population was 63,226.
Founded in 1964, Reston was influenced by the Garden City movement that emphasized planned, self-contained communities that intermingled green space, residential neighborhoods, and commercial development. The intent of Reston's founder, Robert E. Simon, was to build a town that would revolutionize post–World War II concepts of land use and residential/corporate development in suburban America. In 2018, Reston was included in Money magazine's "Best Place to Live in Virginia" ranking. Reston is known for its expanses of parks, lakes, golf courses, and bridle paths, and Reston Town Center, a shopping mall with several restaurants.
Gender
| Gender | Reston | Virginia | Country |
|---|---|---|---|
| Female | 52.2% | 50.8% | 50.8% |
| Male | 47.8% | 49.2% | 49.2% |
Gender
Household Income
| Income | Reston | Virginia | Country |
|---|---|---|---|
| Less than $10,000 | 3.9% | 4.8% | 5.8% |
| $10,000 to $14,999 | 1.4% | 3.3% | 4.1% |
| $15,000 to $24,999 | 2.5% | 7% | 8.5% |
| $25,000 to $34,999 | 3.9% | 7.1% | 8.6% |
| $35,000 to $49,999 | 5.8% | 10.8% | 12.0% |
| $50,000 to $74,999 | 10.3% | 16.3% | 17.2% |
| $75,000 to $99,999 | 12.6% | 12.9% | 12.8% |
| $100,000 to $149,999 | 23.1% | 17.2% | 15.6% |
| $150,000 to $199,999 | 14.7% | 9% | 7.1% |
| $200,000 or more | 21.8% | 11.6% | 8.3% |
Education
| Education | Reston | Virginia | Country |
|---|---|---|---|
| < 9th Grade | 1% | 3% | 5.0% |
| 9-12th Grade | 2% | 6% | 7.0% |
| High School or GED | 9% | 24% | 27.0% |
| Other College | 12% | 19% | 20.0% |
| Associate's Degree | 5% | 8% | 9% |
| Bachelor's Degree | 36% | 22% | 20.0% |
| Master's Degree | 26% | 13% | 9.0% |
| Professional Degree | 4% | 3% | 2.0% |
| Doctorate Degree | 5% | 2% | 1.0% |
Household Income
Education
Race / Ethnicity
| Ethnicity | Reston | Virginia | Country |
|---|---|---|---|
| White | 60.7% | 61.2% | 60.1% |
| African American | 9.2% | 18.7% | 12.2% |
| American Indian | 0% | 0.2% | 0.6% |
| Asian | 11.1% | 6.6% | 5.6% |
| Hawaiian | 0% | 0.1% | 0.2% |
| Other | 0.4% | 0.3% | 0.3% |
| Multiracial | 5.4% | 3.4% | 2.8% |
| Hispanic | 13.2% | 9.5% | 18.2% |
Race / Ethnicity
- ALABAMA
- ALASKA
- ARIZONA
- ARKANSAS
- CALIFORNIA
- COLORADO
- CONNECTICUT
- DELAWARE
- FLORIDA
- GEORGIA
- HAWAII
- IDAHO
- ILLINOIS
- INDIANA
- IOWA
- KANSAS
- KENTUCKY
- LOUISIANA
- MAINE
- MARYLAND
- MASSACHUSETTS
- MICHIGAN
- MINNESOTA
- MISSISSIPPI
- MISSOURI
- MONTANA
- NEBRASKA
- NEVADA
- NEW HAMPSHIRE
- NEW JERSEY
- NEW MEXICO
- NEW YORK
- NORTH CAROLINA
- NORTH DAKOTA
- OHIO
- OKLAHOMA
- OREGON
- PENNSYLVANIA
- RHODE ISLAND
- SOUTH CAROLINA
- SOUTH DAKOTA
- TENNESSEE
- TEXAS
- UTAH
- VERMONT
- VIRGINIA
- WASHINGTON
- WEST VIRGINIA
- WISCONSIN
- WYOMING
