Moving to Danville, Virginia
About Danville, Virginia
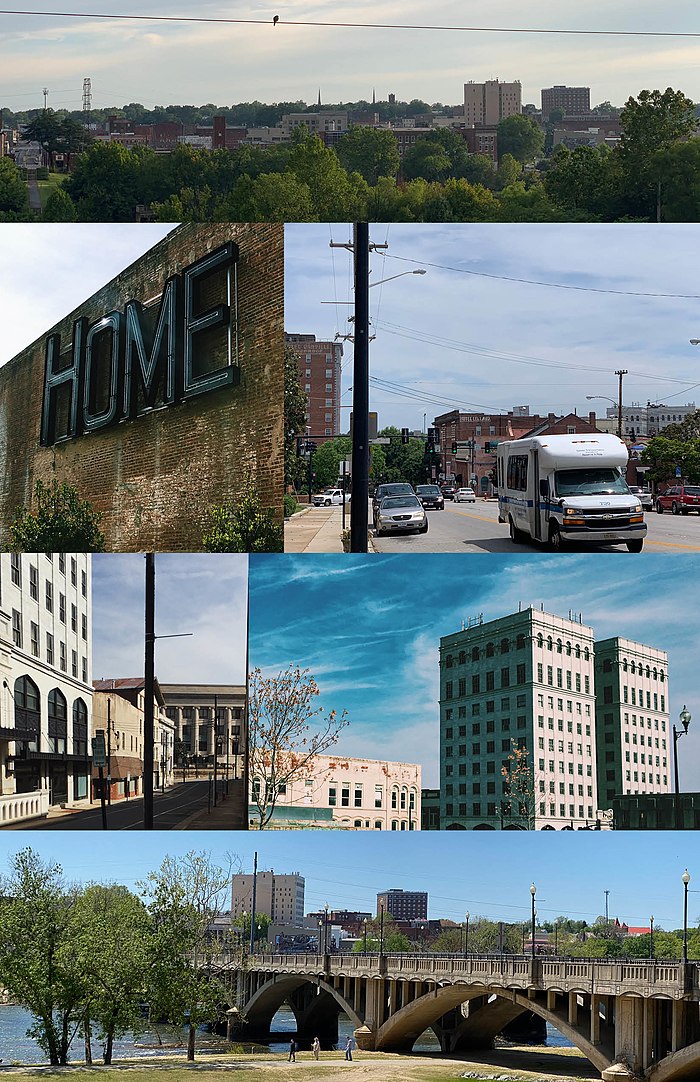
Danville is an independent city in the Commonwealth of Virginia in the United States. The city is located in the Southside Virginia region and on the fall line of the Dan River.
The city was a center of tobacco production and was an area of Confederate activity during the American Civil War, due to its strategic location on the Richmond and Danville Railroad. In April 1865, Danville briefly served as the third and final capital of the Confederacy before its surrender later that year.
Danville has maintained an African American majority population since the Reconstruction era. During this time, the city was represented politically by African American members of the Readjuster Party. However, this changed following the Danville Massacre of 1883, after which Democrats regained control both locally and statewide. Decades later, during the civil rights era, Danville again became a flashpoint for racial violence and resistance to desegregation efforts.
Danville is the principal city of the Danville, Virginia Micropolitan Statistical Area. The Bureau of Economic Analysis combines the city of Danville with surrounding Pittsylvania County for statistical purposes. The population was 42,590 at the 2020 census. It is bounded by Pittsylvania County to the north and Caswell County, North Carolina to the south. It hosts the Danville Otterbots baseball club of the Appalachian League.
Gender
| Gender | Danville | Virginia | Country |
|---|---|---|---|
| Female | 54% | 50.8% | 50.8% |
| Male | 46% | 49.2% | 49.2% |
Gender
Household Income
| Income | Danville | Virginia | Country |
|---|---|---|---|
| Less than $10,000 | 10.6% | 4.8% | 5.8% |
| $10,000 to $14,999 | 10.3% | 3.3% | 4.1% |
| $15,000 to $24,999 | 14.6% | 7% | 8.5% |
| $25,000 to $34,999 | 12.8% | 7.1% | 8.6% |
| $35,000 to $49,999 | 15.4% | 10.8% | 12.0% |
| $50,000 to $74,999 | 17.1% | 16.3% | 17.2% |
| $75,000 to $99,999 | 7.5% | 12.9% | 12.8% |
| $100,000 to $149,999 | 7.5% | 17.2% | 15.6% |
| $150,000 to $199,999 | 2.5% | 9% | 7.1% |
| $200,000 or more | 1.7% | 11.6% | 8.3% |
Education
| Education | Danville | Virginia | Country |
|---|---|---|---|
| < 9th Grade | 5% | 3% | 5.0% |
| 9-12th Grade | 11% | 6% | 7.0% |
| High School or GED | 34% | 24% | 27.0% |
| Other College | 23% | 19% | 20.0% |
| Associate's Degree | 9% | 8% | 9% |
| Bachelor's Degree | 11% | 22% | 20.0% |
| Master's Degree | 5% | 13% | 9.0% |
| Professional Degree | 2% | 3% | 2.0% |
| Doctorate Degree | 0% | 2% | 1.0% |
Household Income
Education
Race / Ethnicity
| Ethnicity | Danville | Virginia | Country |
|---|---|---|---|
| White | 41.6% | 61.2% | 60.1% |
| African American | 48.5% | 18.7% | 12.2% |
| American Indian | 0.1% | 0.2% | 0.6% |
| Asian | 1.3% | 6.6% | 5.6% |
| Hawaiian | 0.1% | 0.1% | 0.2% |
| Other | 0.1% | 0.3% | 0.3% |
| Multiracial | 3.9% | 3.4% | 2.8% |
| Hispanic | 4.5% | 9.5% | 18.2% |
Race / Ethnicity
- ALABAMA
- ALASKA
- ARIZONA
- ARKANSAS
- CALIFORNIA
- COLORADO
- CONNECTICUT
- DELAWARE
- FLORIDA
- GEORGIA
- HAWAII
- IDAHO
- ILLINOIS
- INDIANA
- IOWA
- KANSAS
- KENTUCKY
- LOUISIANA
- MAINE
- MARYLAND
- MASSACHUSETTS
- MICHIGAN
- MINNESOTA
- MISSISSIPPI
- MISSOURI
- MONTANA
- NEBRASKA
- NEVADA
- NEW HAMPSHIRE
- NEW JERSEY
- NEW MEXICO
- NEW YORK
- NORTH CAROLINA
- NORTH DAKOTA
- OHIO
- OKLAHOMA
- OREGON
- PENNSYLVANIA
- RHODE ISLAND
- SOUTH CAROLINA
- SOUTH DAKOTA
- TENNESSEE
- TEXAS
- UTAH
- VERMONT
- VIRGINIA
- WASHINGTON
- WEST VIRGINIA
- WISCONSIN
- WYOMING