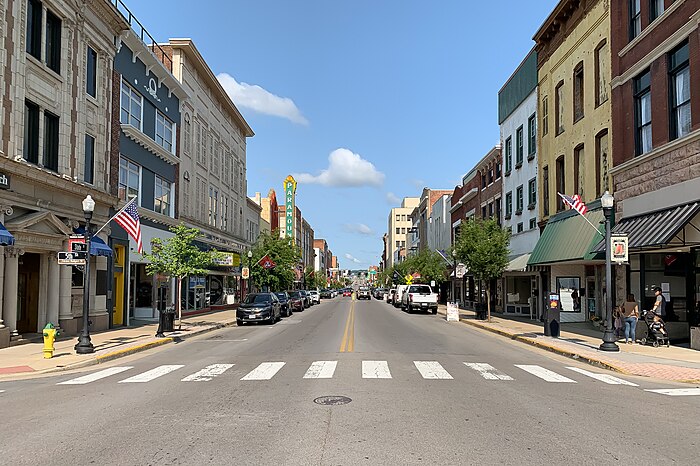
Moving to Bristol, Virginia
About Bristol, Virginia

Bristol is an independent city in the Commonwealth of Virginia. As of the 2020 census, the population was 17,219. It is the twin city of Bristol, Tennessee, just across the state line, which runs down the middle of its main street, State Street. As an independent city, Bristol is not part of any county, but it is adjacent to Washington County, Virginia. It is a principal city in the Kingsport–Bristol metropolitan area, which had a population of 307,614 in 2020. The metro area is a component of the larger Tri-Cities region of Tennessee and Virginia, with a population of 508,260 in 2020.
Gender
| Gender | Bristol | Virginia | Country |
|---|---|---|---|
| Female | 52.4% | 50.8% | 50.8% |
| Male | 47.6% | 49.2% | 49.2% |
Gender
Female Male
Household Income
< $10000 $10K to $15K $15K to $25K $25K to $35K $35K to $50K $50K to $75K $75K to $100K $100K to $150K $150K to $200K $200K or more
| Income | Bristol | Virginia | Country |
|---|---|---|---|
| Less than $10,000 | 8.8% | 4.8% | 5.8% |
| $10,000 to $14,999 | 6.6% | 3.3% | 4.1% |
| $15,000 to $24,999 | 14.6% | 7% | 8.5% |
| $25,000 to $34,999 | 12% | 7.1% | 8.6% |
| $35,000 to $49,999 | 16.2% | 10.8% | 12.0% |
| $50,000 to $74,999 | 17.6% | 16.3% | 17.2% |
| $75,000 to $99,999 | 6.2% | 12.9% | 12.8% |
| $100,000 to $149,999 | 10.1% | 17.2% | 15.6% |
| $150,000 to $199,999 | 6.2% | 9% | 7.1% |
| $200,000 or more | 1.7% | 11.6% | 8.3% |
Education
< 9th Grade 9-12th Grade High School or GED Other College Associate Degree Bachelor Degree Masters Degree Professional Degree Doctorate Degree
| Education | Bristol | Virginia | Country |
|---|---|---|---|
| < 9th Grade | 3% | 3% | 5.0% |
| 9-12th Grade | 12% | 6% | 7.0% |
| High School or GED | 31% | 24% | 27.0% |
| Other College | 25% | 19% | 20.0% |
| Associate's Degree | 8% | 8% | 9% |
| Bachelor's Degree | 10% | 22% | 20.0% |
| Master's Degree | 8% | 13% | 9.0% |
| Professional Degree | 2% | 3% | 2.0% |
| Doctorate Degree | 1% | 2% | 1.0% |
Household Income
Bristol Virginia Country
Education
Bristol Virginia Country
Race / Ethnicity
White African American American Indian Asian Hispanic Hawaiian Mixed Other
| Ethnicity | Bristol | Virginia | Country |
|---|---|---|---|
| White | 87.6% | 61.2% | 60.1% |
| African American | 7.1% | 18.7% | 12.2% |
| American Indian | 0% | 0.2% | 0.6% |
| Asian | 0.2% | 6.6% | 5.6% |
| Hawaiian | 0% | 0.1% | 0.2% |
| Other | 0.8% | 0.3% | 0.3% |
| Multiracial | 3.9% | 3.4% | 2.8% |
| Hispanic | 0.5% | 9.5% | 18.2% |
Race / Ethnicity
Bristol Virginia Country
- ALABAMA
- ALASKA
- ARIZONA
- ARKANSAS
- CALIFORNIA
- COLORADO
- CONNECTICUT
- DELAWARE
- FLORIDA
- GEORGIA
- HAWAII
- IDAHO
- ILLINOIS
- INDIANA
- IOWA
- KANSAS
- KENTUCKY
- LOUISIANA
- MAINE
- MARYLAND
- MASSACHUSETTS
- MICHIGAN
- MINNESOTA
- MISSISSIPPI
- MISSOURI
- MONTANA
- NEBRASKA
- NEVADA
- NEW HAMPSHIRE
- NEW JERSEY
- NEW MEXICO
- NEW YORK
- NORTH CAROLINA
- NORTH DAKOTA
- OHIO
- OKLAHOMA
- OREGON
- PENNSYLVANIA
- RHODE ISLAND
- SOUTH CAROLINA
- SOUTH DAKOTA
- TENNESSEE
- TEXAS
- UTAH
- VERMONT
- VIRGINIA
- WASHINGTON
- WEST VIRGINIA
- WISCONSIN
- WYOMING
