Moving to Bennington, Vermont
About Bennington, Vermont

Bennington is a town in Bennington County, Vermont, United States. It is one of two shire towns (county seats) of the county, the other being Manchester. As of the 2020 US Census, the population was 15,333. Bennington is the most populous town in southern Vermont, the second-largest town in Vermont (after Colchester) and the sixth-largest municipality in the state.
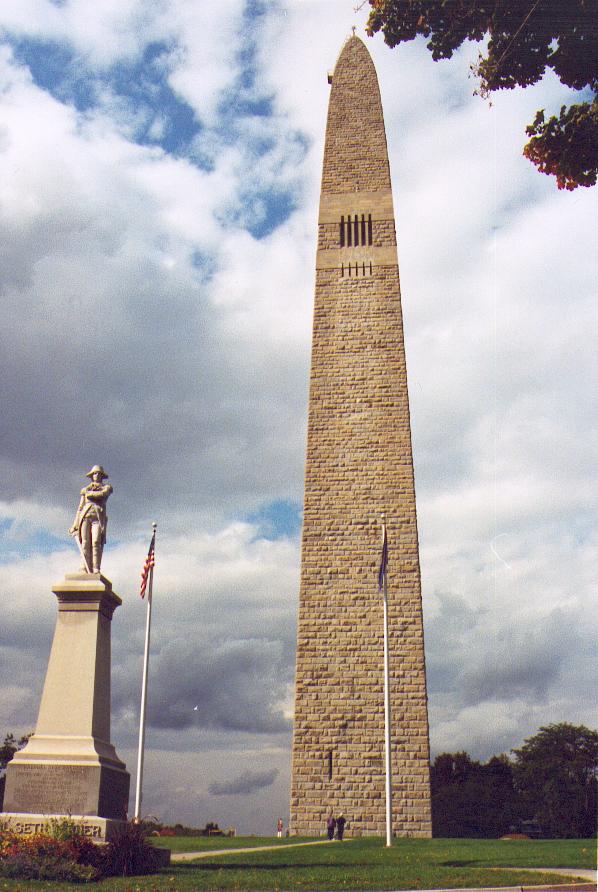
The town is home to the Bennington Battle Monument, which is the tallest human-made structure in the state of Vermont. The town has a long history of manufacturing, primarily within wood processing. The town is also recognized nationally for its pottery, iron, and textiles.
Gender
| Gender | Bennington | Vermont | Country |
|---|---|---|---|
| Female | 50.6% | 50.6% | 50.8% |
| Male | 49.4% | 49.4% | 49.2% |
Gender
Household Income
| Income | Bennington | Vermont | Country |
|---|---|---|---|
| Less than $10,000 | 7.8% | 4.5% | 5.8% |
| $10,000 to $14,999 | 6.9% | 4.9% | 4.1% |
| $15,000 to $24,999 | 7.9% | 8.6% | 8.5% |
| $25,000 to $34,999 | 13.1% | 8.9% | 8.6% |
| $35,000 to $49,999 | 17.3% | 12.3% | 12.0% |
| $50,000 to $74,999 | 16.6% | 18.3% | 17.2% |
| $75,000 to $99,999 | 9.4% | 13.9% | 12.8% |
| $100,000 to $149,999 | 12.8% | 16.4% | 15.6% |
| $150,000 to $199,999 | 5.8% | 6.1% | 7.1% |
| $200,000 or more | 2.3% | 6% | 8.3% |
Education
| Education | Bennington | Vermont | Country |
|---|---|---|---|
| < 9th Grade | 1% | 0% | 5.0% |
| 9-12th Grade | 5% | 5% | 7.0% |
| High School or GED | 30% | 28% | 27.0% |
| Other College | 21% | 17% | 20.0% |
| Associate's Degree | 9% | 9% | 9% |
| Bachelor's Degree | 20% | 24% | 20.0% |
| Master's Degree | 11% | 12% | 9.0% |
| Professional Degree | 2% | 3% | 2.0% |
| Doctorate Degree | 1% | 2% | 1.0% |
Household Income
Education
Race / Ethnicity
| Ethnicity | Bennington | Vermont | Country |
|---|---|---|---|
| White | 93.9% | 92.4% | 60.1% |
| African American | 0.2% | 1.2% | 12.2% |
| American Indian | 0.4% | 0.2% | 0.6% |
| Asian | 0.6% | 1.6% | 5.6% |
| Hawaiian | 0.5% | 0% | 0.2% |
| Other | 0% | 0.2% | 0.3% |
| Multiracial | 2.5% | 2.4% | 2.8% |
| Hispanic | 2% | 2% | 18.2% |
Race / Ethnicity
- ALABAMA
- ALASKA
- ARIZONA
- ARKANSAS
- CALIFORNIA
- COLORADO
- CONNECTICUT
- DELAWARE
- FLORIDA
- GEORGIA
- HAWAII
- IDAHO
- ILLINOIS
- INDIANA
- IOWA
- KANSAS
- KENTUCKY
- LOUISIANA
- MAINE
- MARYLAND
- MASSACHUSETTS
- MICHIGAN
- MINNESOTA
- MISSISSIPPI
- MISSOURI
- MONTANA
- NEBRASKA
- NEVADA
- NEW HAMPSHIRE
- NEW JERSEY
- NEW MEXICO
- NEW YORK
- NORTH CAROLINA
- NORTH DAKOTA
- OHIO
- OKLAHOMA
- OREGON
- PENNSYLVANIA
- RHODE ISLAND
- SOUTH CAROLINA
- SOUTH DAKOTA
- TENNESSEE
- TEXAS
- UTAH
- VERMONT
- VIRGINIA
- WASHINGTON
- WEST VIRGINIA
- WISCONSIN
- WYOMING
