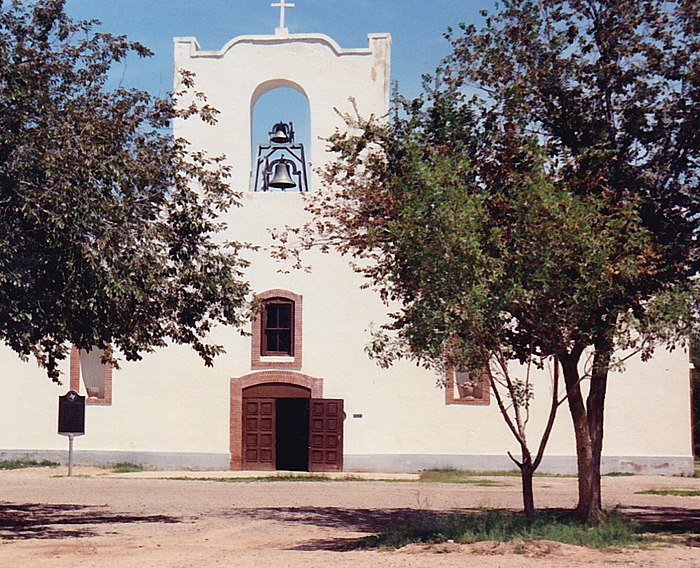
Moving to Socorro, Texas
About Socorro, Texas

Socorro is a city in El Paso County, Texas, United States. It is located on the north bank of the Rio Grande southeast of El Paso, and on the border of Mexico. El Paso adjoins it on the west and the smaller city of San Elizario on the southeast; small unincorporated areas of El Paso County separate it from the nearby municipalities of Horizon City to the north and Clint to the east. As of the 2020 census, the city population was 34,306. By the 2010 census, the number had grown to 32,013. As of July 1, 2019, the population estimate for the city from the U.S. Census was 34,370. It is part of the El Paso Metropolitan Statistical Area. The city is El Paso County's second-largest municipality, after El Paso. It has a council-manager type of government with five city council members.
Gender
| Gender | Socorro | Texas | Country |
|---|---|---|---|
| Female | 54.1% | 50.3% | 50.8% |
| Male | 45.9% | 49.7% | 49.2% |
Gender
Household Income
| Income | Socorro | Texas | Country |
|---|---|---|---|
| Less than $10,000 | 11.8% | 6% | 5.8% |
| $10,000 to $14,999 | 6.6% | 3.9% | 4.1% |
| $15,000 to $24,999 | 13.1% | 8.4% | 8.5% |
| $25,000 to $34,999 | 12% | 8.9% | 8.6% |
| $35,000 to $49,999 | 18.5% | 12.3% | 12.0% |
| $50,000 to $74,999 | 15.9% | 17.6% | 17.2% |
| $75,000 to $99,999 | 12% | 12.5% | 12.8% |
| $100,000 to $149,999 | 6.8% | 15.6% | 15.6% |
| $150,000 to $199,999 | 2.7% | 7% | 7.1% |
| $200,000 or more | 0.5% | 7.8% | 8.3% |
Education
| Education | Socorro | Texas | Country |
|---|---|---|---|
| < 9th Grade | 22% | 7% | 5.0% |
| 9-12th Grade | 15% | 8% | 7.0% |
| High School or GED | 29% | 25% | 27.0% |
| Other College | 16% | 22% | 20.0% |
| Associate's Degree | 11% | 7% | 9% |
| Bachelor's Degree | 6% | 20% | 20.0% |
| Master's Degree | 1% | 8% | 9.0% |
| Professional Degree | 0% | 2% | 2.0% |
| Doctorate Degree | 0% | 1% | 1.0% |
Household Income
Education
Race / Ethnicity
| Ethnicity | Socorro | Texas | Country |
|---|---|---|---|
| White | 2.3% | 41.4% | 60.1% |
| African American | 0% | 11.8% | 12.2% |
| American Indian | 0.8% | 0.2% | 0.6% |
| Asian | 0.1% | 4.9% | 5.6% |
| Hawaiian | 0% | 0.1% | 0.2% |
| Other | 0% | 0.2% | 0.3% |
| Multiracial | 0.1% | 2% | 2.8% |
| Hispanic | 96.6% | 39.4% | 18.2% |
Race / Ethnicity
- ALABAMA
- ALASKA
- ARIZONA
- ARKANSAS
- CALIFORNIA
- COLORADO
- CONNECTICUT
- DELAWARE
- FLORIDA
- GEORGIA
- HAWAII
- IDAHO
- ILLINOIS
- INDIANA
- IOWA
- KANSAS
- KENTUCKY
- LOUISIANA
- MAINE
- MARYLAND
- MASSACHUSETTS
- MICHIGAN
- MINNESOTA
- MISSISSIPPI
- MISSOURI
- MONTANA
- NEBRASKA
- NEVADA
- NEW HAMPSHIRE
- NEW JERSEY
- NEW MEXICO
- NEW YORK
- NORTH CAROLINA
- NORTH DAKOTA
- OHIO
- OKLAHOMA
- OREGON
- PENNSYLVANIA
- RHODE ISLAND
- SOUTH CAROLINA
- SOUTH DAKOTA
- TENNESSEE
- TEXAS
- UTAH
- VERMONT
- VIRGINIA
- WASHINGTON
- WEST VIRGINIA
- WISCONSIN
- WYOMING
