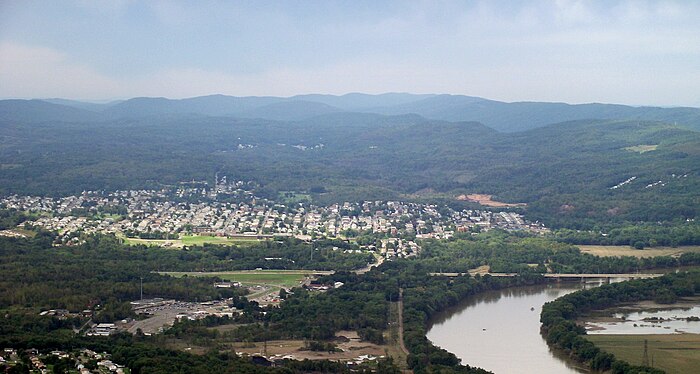
Moving to Nanticoke, Pennsylvania
About Nanticoke, Pennsylvania

Nanticoke is a city in Luzerne County, Pennsylvania, United States. As of the 2020 census, the population was 10,628, making it the third largest city in Luzerne County. It occupies 3.6 square miles (9.3 km2) of land. Nanticoke is part of Northeastern Pennsylvania.
The city can be divided into several sections: Honey Pot (northwestern Nanticoke), (northern and central Nanticoke), and Hanover Section (southeastern Nanticoke). It was once an active coal mining community. Today, the 167-acre main campus of Luzerne County Community College is located within the city.
Gender
| Gender | Nanticoke | Pennsylvania | Country |
|---|---|---|---|
| Female | 48.9% | 51% | 50.8% |
| Male | 51.1% | 49% | 49.2% |
Gender
Household Income
| Income | Nanticoke | Pennsylvania | Country |
|---|---|---|---|
| Less than $10,000 | 9.6% | 5.8% | 5.8% |
| $10,000 to $14,999 | 7.7% | 4% | 4.1% |
| $15,000 to $24,999 | 10.6% | 8.8% | 8.5% |
| $25,000 to $34,999 | 10% | 9% | 8.6% |
| $35,000 to $49,999 | 17.7% | 12.1% | 12.0% |
| $50,000 to $74,999 | 18.1% | 17.6% | 17.2% |
| $75,000 to $99,999 | 11.7% | 13.2% | 12.8% |
| $100,000 to $149,999 | 9.7% | 15.7% | 15.6% |
| $150,000 to $199,999 | 2.5% | 6.7% | 7.1% |
| $200,000 or more | 2.3% | 7.1% | 8.3% |
Education
| Education | Nanticoke | Pennsylvania | Country |
|---|---|---|---|
| < 9th Grade | 3% | 2% | 5.0% |
| 9-12th Grade | 11% | 6% | 7.0% |
| High School or GED | 42% | 34% | 27.0% |
| Other College | 16% | 16% | 20.0% |
| Associate's Degree | 10% | 9% | 9% |
| Bachelor's Degree | 13% | 20% | 20.0% |
| Master's Degree | 3% | 9% | 9.0% |
| Professional Degree | 1% | 2% | 2.0% |
| Doctorate Degree | 1% | 2% | 1.0% |
Household Income
Education
Race / Ethnicity
| Ethnicity | Nanticoke | Pennsylvania | Country |
|---|---|---|---|
| White | 82.8% | 75.7% | 60.1% |
| African American | 4.4% | 10.6% | 12.2% |
| American Indian | 0.4% | 0.1% | 0.6% |
| Asian | 0.1% | 3.5% | 5.6% |
| Hawaiian | 0.3% | 0% | 0.2% |
| Other | 0% | 0.3% | 0.3% |
| Multiracial | 2% | 2.2% | 2.8% |
| Hispanic | 10.1% | 7.6% | 18.2% |
Race / Ethnicity
- ALABAMA
- ALASKA
- ARIZONA
- ARKANSAS
- CALIFORNIA
- COLORADO
- CONNECTICUT
- DELAWARE
- FLORIDA
- GEORGIA
- HAWAII
- IDAHO
- ILLINOIS
- INDIANA
- IOWA
- KANSAS
- KENTUCKY
- LOUISIANA
- MAINE
- MARYLAND
- MASSACHUSETTS
- MICHIGAN
- MINNESOTA
- MISSISSIPPI
- MISSOURI
- MONTANA
- NEBRASKA
- NEVADA
- NEW HAMPSHIRE
- NEW JERSEY
- NEW MEXICO
- NEW YORK
- NORTH CAROLINA
- NORTH DAKOTA
- OHIO
- OKLAHOMA
- OREGON
- PENNSYLVANIA
- RHODE ISLAND
- SOUTH CAROLINA
- SOUTH DAKOTA
- TENNESSEE
- TEXAS
- UTAH
- VERMONT
- VIRGINIA
- WASHINGTON
- WEST VIRGINIA
- WISCONSIN
- WYOMING
