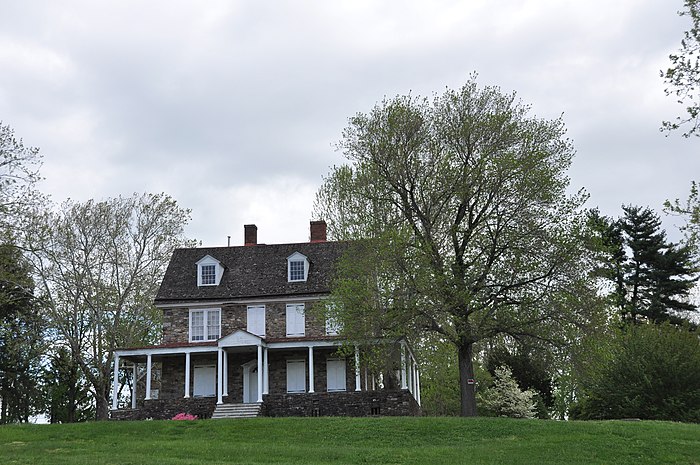
Moving to Levittown, Pennsylvania
About Levittown, Pennsylvania

Levittown is a census-designated place (CDP) and planned community in Bucks County, Pennsylvania, United States. It is part of the Philadelphia metropolitan area. The population was 52,699 at the 2020 census, down from 52,983 at the 2010 census.
Levittown is 40 feet (12 m) above sea level. Though not a municipality, it is sometimes recognized as the largest suburb of Philadelphia while Upper Darby, Lower Merion, Bensalem, Abington, and Bristol townships are municipalities larger in size within the three surrounding Pennsylvania counties. Starting with land purchased in 1951, it was planned and built by Levitt & Sons. The brothers William Levitt and architect Alfred Levitt designed its six typical houses.
Levittown is located 72.5 miles (116.7 km) southeast of Allentown and 26.6 miles (42.8 km) northeast of Philadelphia.
Gender
| Gender | Levittown | Pennsylvania | Country |
|---|---|---|---|
| Female | 51% | 51% | 50.8% |
| Male | 49% | 49% | 49.2% |
Gender
Household Income
| Income | Levittown | Pennsylvania | Country |
|---|---|---|---|
| Less than $10,000 | 2.5% | 5.8% | 5.8% |
| $10,000 to $14,999 | 2.8% | 4% | 4.1% |
| $15,000 to $24,999 | 5.5% | 8.8% | 8.5% |
| $25,000 to $34,999 | 6.5% | 9% | 8.6% |
| $35,000 to $49,999 | 7% | 12.1% | 12.0% |
| $50,000 to $74,999 | 17.8% | 17.6% | 17.2% |
| $75,000 to $99,999 | 17.3% | 13.2% | 12.8% |
| $100,000 to $149,999 | 27.3% | 15.7% | 15.6% |
| $150,000 to $199,999 | 9% | 6.7% | 7.1% |
| $200,000 or more | 4.3% | 7.1% | 8.3% |
Education
| Education | Levittown | Pennsylvania | Country |
|---|---|---|---|
| < 9th Grade | 2% | 2% | 5.0% |
| 9-12th Grade | 6% | 6% | 7.0% |
| High School or GED | 42% | 34% | 27.0% |
| Other College | 18% | 16% | 20.0% |
| Associate's Degree | 9% | 9% | 9% |
| Bachelor's Degree | 15% | 20% | 20.0% |
| Master's Degree | 6% | 9% | 9.0% |
| Professional Degree | 1% | 2% | 2.0% |
| Doctorate Degree | 1% | 2% | 1.0% |
Household Income
Education
Race / Ethnicity
| Ethnicity | Levittown | Pennsylvania | Country |
|---|---|---|---|
| White | 82.8% | 75.7% | 60.1% |
| African American | 3.9% | 10.6% | 12.2% |
| American Indian | 0% | 0.1% | 0.6% |
| Asian | 1.8% | 3.5% | 5.6% |
| Hawaiian | 0% | 0% | 0.2% |
| Other | 0.1% | 0.3% | 0.3% |
| Multiracial | 2.8% | 2.2% | 2.8% |
| Hispanic | 8.6% | 7.6% | 18.2% |
Race / Ethnicity
- ALABAMA
- ALASKA
- ARIZONA
- ARKANSAS
- CALIFORNIA
- COLORADO
- CONNECTICUT
- DELAWARE
- FLORIDA
- GEORGIA
- HAWAII
- IDAHO
- ILLINOIS
- INDIANA
- IOWA
- KANSAS
- KENTUCKY
- LOUISIANA
- MAINE
- MARYLAND
- MASSACHUSETTS
- MICHIGAN
- MINNESOTA
- MISSISSIPPI
- MISSOURI
- MONTANA
- NEBRASKA
- NEVADA
- NEW HAMPSHIRE
- NEW JERSEY
- NEW MEXICO
- NEW YORK
- NORTH CAROLINA
- NORTH DAKOTA
- OHIO
- OKLAHOMA
- OREGON
- PENNSYLVANIA
- RHODE ISLAND
- SOUTH CAROLINA
- SOUTH DAKOTA
- TENNESSEE
- TEXAS
- UTAH
- VERMONT
- VIRGINIA
- WASHINGTON
- WEST VIRGINIA
- WISCONSIN
- WYOMING
