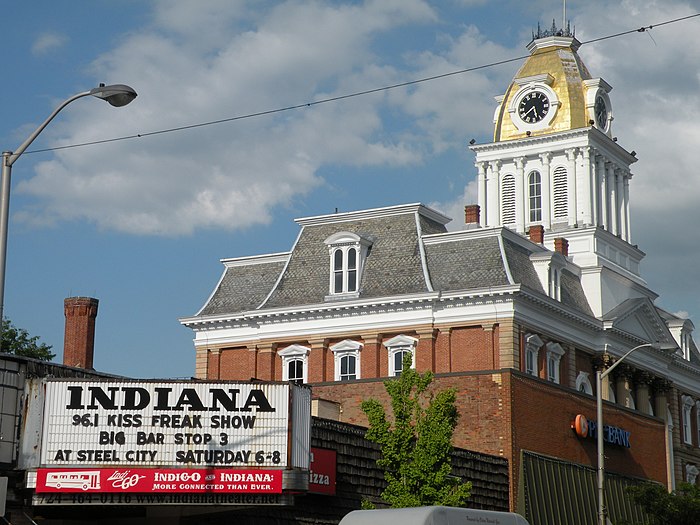
Moving to Indiana, Pennsylvania
About Indiana, Pennsylvania

Indiana is a borough in Indiana County, Pennsylvania, United States, and its county seat. The population was 14,044 at the 2020 census. It is the principal city of the Indiana, Pennsylvania micropolitan area, about 46 miles (74 km) northeast of Pittsburgh. It is a part of the greater Pittsburgh–New Castle–Weirton combined statistical area, as well as the Johnstown and Pittsburgh media markets.
The borough and the region as a whole promote itself as the "Christmas Tree Capital of the World" because the national Christmas Tree Growers Association was founded there. There are still many Christmas tree farms in the area. The largest employer in the borough today is Indiana University of Pennsylvania, the second-largest of 14 PASSHE schools in the state.
Gender
| Gender | Indiana | Pennsylvania | Country |
|---|---|---|---|
| Female | 51.2% | 51% | 50.8% |
| Male | 48.8% | 49% | 49.2% |
Gender
Household Income
| Income | Indiana | Pennsylvania | Country |
|---|---|---|---|
| Less than $10,000 | 18.2% | 5.8% | 5.8% |
| $10,000 to $14,999 | 5.7% | 4% | 4.1% |
| $15,000 to $24,999 | 20.8% | 8.8% | 8.5% |
| $25,000 to $34,999 | 10.7% | 9% | 8.6% |
| $35,000 to $49,999 | 9.7% | 12.1% | 12.0% |
| $50,000 to $74,999 | 10.5% | 17.6% | 17.2% |
| $75,000 to $99,999 | 9.1% | 13.2% | 12.8% |
| $100,000 to $149,999 | 9.6% | 15.7% | 15.6% |
| $150,000 to $199,999 | 4.5% | 6.7% | 7.1% |
| $200,000 or more | 1.2% | 7.1% | 8.3% |
Education
| Education | Indiana | Pennsylvania | Country |
|---|---|---|---|
| < 9th Grade | 0% | 2% | 5.0% |
| 9-12th Grade | 8% | 6% | 7.0% |
| High School or GED | 22% | 34% | 27.0% |
| Other College | 14% | 16% | 20.0% |
| Associate's Degree | 5% | 9% | 9% |
| Bachelor's Degree | 26% | 20% | 20.0% |
| Master's Degree | 17% | 9% | 9.0% |
| Professional Degree | 4% | 2% | 2.0% |
| Doctorate Degree | 4% | 2% | 1.0% |
Household Income
Education
Race / Ethnicity
| Ethnicity | Indiana | Pennsylvania | Country |
|---|---|---|---|
| White | 86.1% | 75.7% | 60.1% |
| African American | 5.4% | 10.6% | 12.2% |
| American Indian | 0.2% | 0.1% | 0.6% |
| Asian | 2.5% | 3.5% | 5.6% |
| Hawaiian | 0% | 0% | 0.2% |
| Other | 0% | 0.3% | 0.3% |
| Multiracial | 3.5% | 2.2% | 2.8% |
| Hispanic | 2.3% | 7.6% | 18.2% |
Race / Ethnicity
- ALABAMA
- ALASKA
- ARIZONA
- ARKANSAS
- CALIFORNIA
- COLORADO
- CONNECTICUT
- DELAWARE
- FLORIDA
- GEORGIA
- HAWAII
- IDAHO
- ILLINOIS
- INDIANA
- IOWA
- KANSAS
- KENTUCKY
- LOUISIANA
- MAINE
- MARYLAND
- MASSACHUSETTS
- MICHIGAN
- MINNESOTA
- MISSISSIPPI
- MISSOURI
- MONTANA
- NEBRASKA
- NEVADA
- NEW HAMPSHIRE
- NEW JERSEY
- NEW MEXICO
- NEW YORK
- NORTH CAROLINA
- NORTH DAKOTA
- OHIO
- OKLAHOMA
- OREGON
- PENNSYLVANIA
- RHODE ISLAND
- SOUTH CAROLINA
- SOUTH DAKOTA
- TENNESSEE
- TEXAS
- UTAH
- VERMONT
- VIRGINIA
- WASHINGTON
- WEST VIRGINIA
- WISCONSIN
- WYOMING
