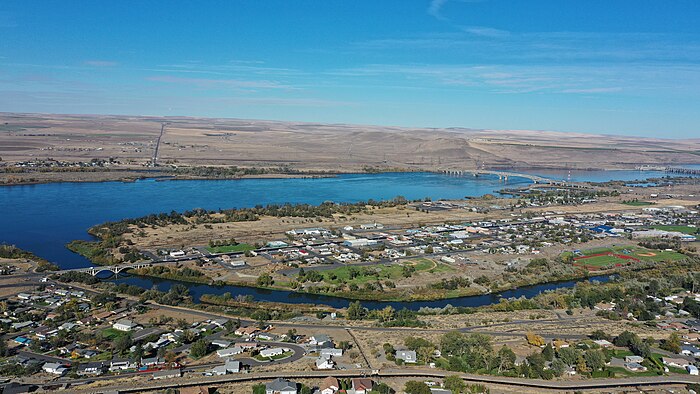
Moving to Umatilla, Oregon
About Umatilla, Oregon

Umatilla (, YOO-mə-TIL-ə) is a city in Umatilla County, Oregon, United States. The population in 2010 was 6,906, but the city's population includes approximately 2,000 inmates incarcerated at Two Rivers Correctional Institution.
Umatilla is part of the Hermiston-Pendleton Micropolitan Statistical Area, but has the highest poverty rate (24%) and lowest Median Household Income ($38,796) of all communities in the area, trailing neighboring Hermiston in household income by nearly 23%.
The city is on the south side of the Columbia River along U.S. Route 730 and I-82. The Umatilla Chemical Depot, is 6 miles (10 km) southwest of the city, northwest of the intersection of I-84 and I-82.
Gender
| Gender | Umatilla | Oregon | Country |
|---|---|---|---|
| Female | 31% | 50.4% | 50.8% |
| Male | 69% | 49.6% | 49.2% |
Gender
Household Income
| Income | Umatilla | Oregon | Country |
|---|---|---|---|
| Less than $10,000 | 10.1% | 5.4% | 5.8% |
| $10,000 to $14,999 | 0.7% | 3.8% | 4.1% |
| $15,000 to $24,999 | 13.7% | 8.1% | 8.5% |
| $25,000 to $34,999 | 8.9% | 8.7% | 8.6% |
| $35,000 to $49,999 | 20.9% | 12.2% | 12.0% |
| $50,000 to $74,999 | 26.8% | 18.1% | 17.2% |
| $75,000 to $99,999 | 10.1% | 13.3% | 12.8% |
| $100,000 to $149,999 | 4.6% | 16.2% | 15.6% |
| $150,000 to $199,999 | 2.6% | 7% | 7.1% |
| $200,000 or more | 1.6% | 7.2% | 8.3% |
Education
| Education | Umatilla | Oregon | Country |
|---|---|---|---|
| < 9th Grade | 10% | 4% | 5.0% |
| 9-12th Grade | 10% | 5% | 7.0% |
| High School or GED | 38% | 23% | 27.0% |
| Other College | 22% | 25% | 20.0% |
| Associate's Degree | 8% | 9% | 9% |
| Bachelor's Degree | 10% | 21% | 20.0% |
| Master's Degree | 2% | 9% | 9.0% |
| Professional Degree | 0% | 2% | 2.0% |
| Doctorate Degree | 0% | 2% | 1.0% |
Household Income
Education
Race / Ethnicity
| Ethnicity | Umatilla | Oregon | Country |
|---|---|---|---|
| White | 51.2% | 74.9% | 60.1% |
| African American | 3.1% | 1.8% | 12.2% |
| American Indian | 0.7% | 0.9% | 0.6% |
| Asian | 0.1% | 4.4% | 5.6% |
| Hawaiian | 0% | 0.4% | 0.2% |
| Other | 0.2% | 0.3% | 0.3% |
| Multiracial | 3% | 4.1% | 2.8% |
| Hispanic | 41.7% | 13.2% | 18.2% |
Race / Ethnicity
- ALABAMA
- ALASKA
- ARIZONA
- ARKANSAS
- CALIFORNIA
- COLORADO
- CONNECTICUT
- DELAWARE
- FLORIDA
- GEORGIA
- HAWAII
- IDAHO
- ILLINOIS
- INDIANA
- IOWA
- KANSAS
- KENTUCKY
- LOUISIANA
- MAINE
- MARYLAND
- MASSACHUSETTS
- MICHIGAN
- MINNESOTA
- MISSISSIPPI
- MISSOURI
- MONTANA
- NEBRASKA
- NEVADA
- NEW HAMPSHIRE
- NEW JERSEY
- NEW MEXICO
- NEW YORK
- NORTH CAROLINA
- NORTH DAKOTA
- OHIO
- OKLAHOMA
- OREGON
- PENNSYLVANIA
- RHODE ISLAND
- SOUTH CAROLINA
- SOUTH DAKOTA
- TENNESSEE
- TEXAS
- UTAH
- VERMONT
- VIRGINIA
- WASHINGTON
- WEST VIRGINIA
- WISCONSIN
- WYOMING
