Moving to Salem, Oregon
About Salem, Oregon
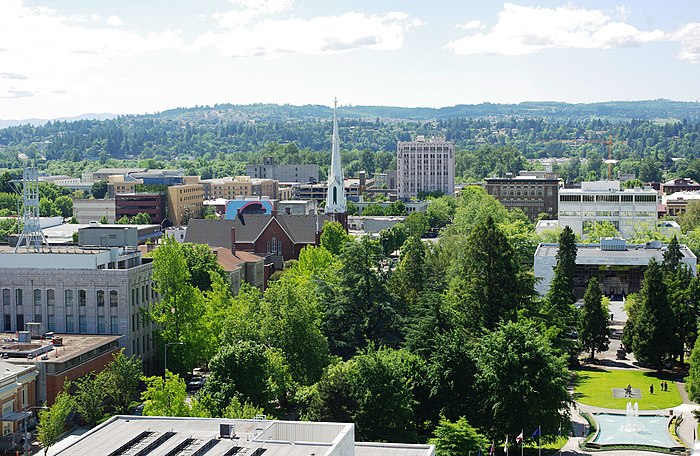
Salem ( SAY-ləm) is the capital city of the U.S. state of Oregon, and the county seat of Marion County. It is located in the center of the Willamette Valley alongside the Willamette River, which runs north through the city. The river forms the boundary between Marion and Polk counties, and the city neighborhood of West Salem is in Polk County. Salem was founded in 1842, became the capital of the Oregon Territory in 1851, and was incorporated in 1857.
Salem had a population of 175,535 at the 2020 United States census, making it the third-most populous city in the state after Portland and Eugene. Salem is the principal city of the Salem Metropolitan Statistical Area, a metropolitan area that covers Marion and Polk counties and had a combined population of 433,353 at the 2020 United States census. This area is, in turn, part of the Portland–Vancouver–Salem Combined Statistical Area.
The city is home to Willamette University, Corban University, and Chemeketa Community College. The State of Oregon is the largest public employer in the city, and Salem Health is the largest private employer. Transportation includes public transit from Cherriots (legally known as Salem Area Mass Transit District), Amtrak service, as well as limited commercial and non-commercial air travel at McNary Field. Major roads include Interstate 5, Oregon Route 99E, and Oregon Route 22, which connects West Salem across the Willamette River via the Marion Street and Center Street bridges.
Gender
| Gender | Salem | Oregon | Country |
|---|---|---|---|
| Female | 49.4% | 50.4% | 50.8% |
| Male | 50.6% | 49.6% | 49.2% |
Gender
Household Income
| Income | Salem | Oregon | Country |
|---|---|---|---|
| Less than $10,000 | 5.3% | 5.4% | 5.8% |
| $10,000 to $14,999 | 4.4% | 3.8% | 4.1% |
| $15,000 to $24,999 | 8.9% | 8.1% | 8.5% |
| $25,000 to $34,999 | 10.5% | 8.7% | 8.6% |
| $35,000 to $49,999 | 13.2% | 12.2% | 12.0% |
| $50,000 to $74,999 | 19.7% | 18.1% | 17.2% |
| $75,000 to $99,999 | 13.6% | 13.3% | 12.8% |
| $100,000 to $149,999 | 15% | 16.2% | 15.6% |
| $150,000 to $199,999 | 5.7% | 7% | 7.1% |
| $200,000 or more | 3.7% | 7.2% | 8.3% |
Education
| Education | Salem | Oregon | Country |
|---|---|---|---|
| < 9th Grade | 7% | 4% | 5.0% |
| 9-12th Grade | 6% | 5% | 7.0% |
| High School or GED | 23% | 23% | 27.0% |
| Other College | 26% | 25% | 20.0% |
| Associate's Degree | 9% | 9% | 9% |
| Bachelor's Degree | 18% | 21% | 20.0% |
| Master's Degree | 8% | 9% | 9.0% |
| Professional Degree | 2% | 2% | 2.0% |
| Doctorate Degree | 1% | 2% | 1.0% |
Household Income
Education
Race / Ethnicity
| Ethnicity | Salem | Oregon | Country |
|---|---|---|---|
| White | 66.6% | 74.9% | 60.1% |
| African American | 1.1% | 1.8% | 12.2% |
| American Indian | 0.8% | 0.9% | 0.6% |
| Asian | 3.1% | 4.4% | 5.6% |
| Hawaiian | 1.5% | 0.4% | 0.2% |
| Other | 0.3% | 0.3% | 0.3% |
| Multiracial | 4.2% | 4.1% | 2.8% |
| Hispanic | 22.4% | 13.2% | 18.2% |
Race / Ethnicity
- ALABAMA
- ALASKA
- ARIZONA
- ARKANSAS
- CALIFORNIA
- COLORADO
- CONNECTICUT
- DELAWARE
- FLORIDA
- GEORGIA
- HAWAII
- IDAHO
- ILLINOIS
- INDIANA
- IOWA
- KANSAS
- KENTUCKY
- LOUISIANA
- MAINE
- MARYLAND
- MASSACHUSETTS
- MICHIGAN
- MINNESOTA
- MISSISSIPPI
- MISSOURI
- MONTANA
- NEBRASKA
- NEVADA
- NEW HAMPSHIRE
- NEW JERSEY
- NEW MEXICO
- NEW YORK
- NORTH CAROLINA
- NORTH DAKOTA
- OHIO
- OKLAHOMA
- OREGON
- PENNSYLVANIA
- RHODE ISLAND
- SOUTH CAROLINA
- SOUTH DAKOTA
- TENNESSEE
- TEXAS
- UTAH
- VERMONT
- VIRGINIA
- WASHINGTON
- WEST VIRGINIA
- WISCONSIN
- WYOMING