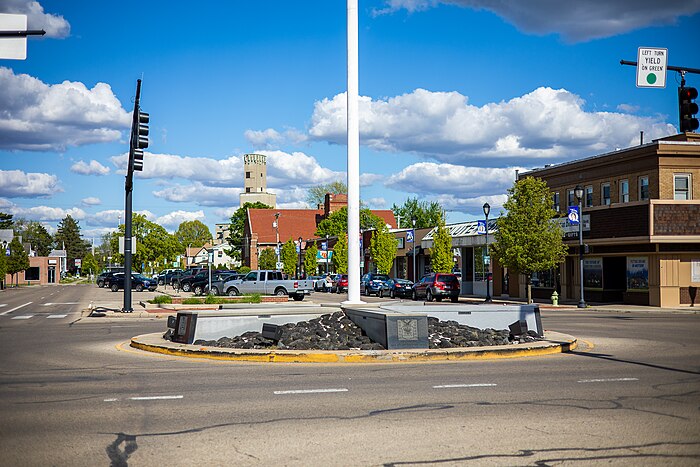
Moving to Fairborn, Ohio
About Fairborn, Ohio

Fairborn is a city in Greene County, Ohio, United States. The population was 34,620 at the 2020 census. It is a suburb of Dayton and part of the Dayton metropolitan area. The city is home to Wright State University, which serves nearly 12,000 undergraduate and graduate students. The city also hosts the disaster training facility known informally as Calamityville.
It is the only city in the world named Fairborn, a portmanteau created from the names Fairfield and Osborn. After the Great Dayton Flood of 1913, the region and state created a conservation district here and, in the 1920s, began building Huffman Dam to control the Mad River. Residents of Osborn were moved with their houses to an area alongside Fairfield. In 1950, the two villages merged into the new city of Fairborn.
Gender
| Gender | Fairborn | Ohio | Country |
|---|---|---|---|
| Female | 52.2% | 51% | 50.8% |
| Male | 47.8% | 49% | 49.2% |
Gender
Household Income
| Income | Fairborn | Ohio | Country |
|---|---|---|---|
| Less than $10,000 | 7.4% | 6.6% | 5.8% |
| $10,000 to $14,999 | 6.2% | 4.4% | 4.1% |
| $15,000 to $24,999 | 10% | 9.5% | 8.5% |
| $25,000 to $34,999 | 11.9% | 9.6% | 8.6% |
| $35,000 to $49,999 | 15.3% | 13.3% | 12.0% |
| $50,000 to $74,999 | 17.8% | 18.4% | 17.2% |
| $75,000 to $99,999 | 13.1% | 13% | 12.8% |
| $100,000 to $149,999 | 12.7% | 14.4% | 15.6% |
| $150,000 to $199,999 | 4.2% | 5.6% | 7.1% |
| $200,000 or more | 1.4% | 5.2% | 8.3% |
Education
| Education | Fairborn | Ohio | Country |
|---|---|---|---|
| < 9th Grade | 3% | 2% | 5.0% |
| 9-12th Grade | 7% | 7% | 7.0% |
| High School or GED | 25% | 33% | 27.0% |
| Other College | 23% | 20% | 20.0% |
| Associate's Degree | 13% | 9% | 9% |
| Bachelor's Degree | 17% | 18% | 20.0% |
| Master's Degree | 10% | 8% | 9.0% |
| Professional Degree | 1% | 2% | 2.0% |
| Doctorate Degree | 1% | 1% | 1.0% |
Household Income
Education
Race / Ethnicity
| Ethnicity | Fairborn | Ohio | Country |
|---|---|---|---|
| White | 79.6% | 78.3% | 60.1% |
| African American | 8.3% | 12.2% | 12.2% |
| American Indian | 0% | 0.1% | 0.6% |
| Asian | 2.4% | 2.3% | 5.6% |
| Hawaiian | 0% | 0% | 0.2% |
| Other | 0% | 0.3% | 0.3% |
| Multiracial | 5.7% | 2.9% | 2.8% |
| Hispanic | 3.9% | 3.9% | 18.2% |
Race / Ethnicity
- ALABAMA
- ALASKA
- ARIZONA
- ARKANSAS
- CALIFORNIA
- COLORADO
- CONNECTICUT
- DELAWARE
- FLORIDA
- GEORGIA
- HAWAII
- IDAHO
- ILLINOIS
- INDIANA
- IOWA
- KANSAS
- KENTUCKY
- LOUISIANA
- MAINE
- MARYLAND
- MASSACHUSETTS
- MICHIGAN
- MINNESOTA
- MISSISSIPPI
- MISSOURI
- MONTANA
- NEBRASKA
- NEVADA
- NEW HAMPSHIRE
- NEW JERSEY
- NEW MEXICO
- NEW YORK
- NORTH CAROLINA
- NORTH DAKOTA
- OHIO
- OKLAHOMA
- OREGON
- PENNSYLVANIA
- RHODE ISLAND
- SOUTH CAROLINA
- SOUTH DAKOTA
- TENNESSEE
- TEXAS
- UTAH
- VERMONT
- VIRGINIA
- WASHINGTON
- WEST VIRGINIA
- WISCONSIN
- WYOMING
