Moving to Jackpot, Nevada
About Jackpot, Nevada

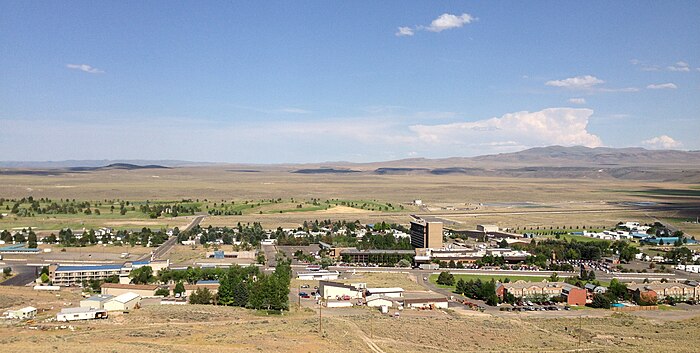
Jackpot is an unincorporated community and census-designated place (CDP) in Elko County, Nevada, United States. The population was 855 as of the 2020 census. Located less than one mile (1.6 km) from the Idaho border on US 93, Jackpot has been a popular casino gaming destination for residents of Idaho and other neighboring states since its founding.
Jackpot is located 47 miles (76 km) south of Twin Falls, Idaho, a city of approximately 50,000. Although officially part of the Elko micropolitan area, Jackpot is often considered part of the Greater Twin Falls region.
In addition to its casino industry, Jackpot has its own schools, golf course, and post office. Its elevation is approximately 5,200 feet (1,580 m) above sea level.
Jackpot observes Mountain Time, along with other Idaho border towns such as Jarbidge, Mountain City and Owyhee, due to its economic ties with the Magic Valley region of southern Idaho. The Nevada Department of Transportation and Federal Aviation Administration recognize this local unofficial observance.
Gender
| Gender | Jackpot | Nevada | Country |
|---|---|---|---|
| Female | 42.6% | 49.8% | 50.8% |
| Male | 57.4% | 50.2% | 49.2% |
Gender
Household Income
| Income | Jackpot | Nevada | Country |
|---|---|---|---|
| Less than $10,000 | 15.2% | 5.9% | 5.8% |
| $10,000 to $14,999 | 8.1% | 3.5% | 4.1% |
| $15,000 to $24,999 | 18.4% | 8.5% | 8.5% |
| $25,000 to $34,999 | 21% | 9.1% | 8.6% |
| $35,000 to $49,999 | 11.8% | 13.3% | 12.0% |
| $50,000 to $74,999 | 11.8% | 18.5% | 17.2% |
| $75,000 to $99,999 | 11.8% | 13.7% | 12.8% |
| $100,000 to $149,999 | 0% | 15.4% | 15.6% |
| $150,000 to $199,999 | 0% | 6.2% | 7.1% |
| $200,000 or more | 1.9% | 5.9% | 8.3% |
Education
| Education | Jackpot | Nevada | Country |
|---|---|---|---|
| < 9th Grade | 45% | 5% | 5.0% |
| 9-12th Grade | 2% | 8% | 7.0% |
| High School or GED | 18% | 28% | 27.0% |
| Other College | 23% | 25% | 20.0% |
| Associate's Degree | 3% | 8% | 9% |
| Bachelor's Degree | 4% | 17% | 20.0% |
| Master's Degree | 3% | 6% | 9.0% |
| Professional Degree | 2% | 2% | 2.0% |
| Doctorate Degree | 0% | 1% | 1.0% |
Household Income
Education
Race / Ethnicity
| Ethnicity | Jackpot | Nevada | Country |
|---|---|---|---|
| White | 24.3% | 48.2% | 60.1% |
| African American | 0% | 9% | 12.2% |
| American Indian | 0% | 0.9% | 0.6% |
| Asian | 0% | 8.1% | 5.6% |
| Hawaiian | 0% | 0.6% | 0.2% |
| Other | 0% | 0.4% | 0.3% |
| Multiracial | 1.3% | 3.9% | 2.8% |
| Hispanic | 74.4% | 28.9% | 18.2% |
Race / Ethnicity
- ALABAMA
- ALASKA
- ARIZONA
- ARKANSAS
- CALIFORNIA
- COLORADO
- CONNECTICUT
- DELAWARE
- FLORIDA
- GEORGIA
- HAWAII
- IDAHO
- ILLINOIS
- INDIANA
- IOWA
- KANSAS
- KENTUCKY
- LOUISIANA
- MAINE
- MARYLAND
- MASSACHUSETTS
- MICHIGAN
- MINNESOTA
- MISSISSIPPI
- MISSOURI
- MONTANA
- NEBRASKA
- NEVADA
- NEW HAMPSHIRE
- NEW JERSEY
- NEW MEXICO
- NEW YORK
- NORTH CAROLINA
- NORTH DAKOTA
- OHIO
- OKLAHOMA
- OREGON
- PENNSYLVANIA
- RHODE ISLAND
- SOUTH CAROLINA
- SOUTH DAKOTA
- TENNESSEE
- TEXAS
- UTAH
- VERMONT
- VIRGINIA
- WASHINGTON
- WEST VIRGINIA
- WISCONSIN
- WYOMING
