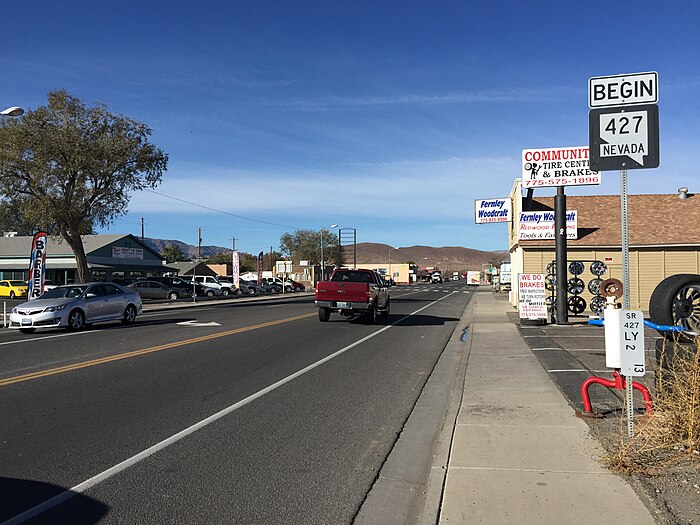
Moving to Fernley, Nevada
About Fernley, Nevada

Fernley is a city in Lyon County, Nevada, United States, and part of the Reno–Tahoe–Sparks metropolitan area CSA. The city was incorporated in 2001. The population of the city was 22,895 at the 2020 census, making it the 7th most populous city in Nevada.
Fernley was home to the historic and one of the first Amazon.com centers in the world, which has since relocated within the metro area. Naval Air Station (TOPGUN), the U.S. Navy's Naval Strike and Air Warfare Center & TOPGUN training program since 1996, was moved nearby, to Fallon, from Naval Air Station Miramar. The city is home to the Reno-Fernley Raceway. The world's first Tesla Gigafactory 1 that produces battery packs, energy storage and electric vehicle components is nearby 15 miles west at the Tahoe Reno Industrial Center, and also there as of 2024 an under-construction lithium processing plant.
Gender
| Gender | Fernley | Nevada | Country |
|---|---|---|---|
| Female | 49.9% | 49.8% | 50.8% |
| Male | 50.1% | 50.2% | 49.2% |
Gender
Household Income
| Income | Fernley | Nevada | Country |
|---|---|---|---|
| Less than $10,000 | 3.4% | 5.9% | 5.8% |
| $10,000 to $14,999 | 2.9% | 3.5% | 4.1% |
| $15,000 to $24,999 | 5.3% | 8.5% | 8.5% |
| $25,000 to $34,999 | 6.5% | 9.1% | 8.6% |
| $35,000 to $49,999 | 13.8% | 13.3% | 12.0% |
| $50,000 to $74,999 | 24.1% | 18.5% | 17.2% |
| $75,000 to $99,999 | 19.6% | 13.7% | 12.8% |
| $100,000 to $149,999 | 18.9% | 15.4% | 15.6% |
| $150,000 to $199,999 | 2.2% | 6.2% | 7.1% |
| $200,000 or more | 3.3% | 5.9% | 8.3% |
Education
| Education | Fernley | Nevada | Country |
|---|---|---|---|
| < 9th Grade | 3% | 5% | 5.0% |
| 9-12th Grade | 7% | 8% | 7.0% |
| High School or GED | 39% | 28% | 27.0% |
| Other College | 31% | 25% | 20.0% |
| Associate's Degree | 9% | 8% | 9% |
| Bachelor's Degree | 8% | 17% | 20.0% |
| Master's Degree | 2% | 6% | 9.0% |
| Professional Degree | 1% | 2% | 2.0% |
| Doctorate Degree | 0% | 1% | 1.0% |
Household Income
Education
Race / Ethnicity
| Ethnicity | Fernley | Nevada | Country |
|---|---|---|---|
| White | 69.1% | 48.2% | 60.1% |
| African American | 2% | 9% | 12.2% |
| American Indian | 1.8% | 0.9% | 0.6% |
| Asian | 1.4% | 8.1% | 5.6% |
| Hawaiian | 0% | 0.6% | 0.2% |
| Other | 0.4% | 0.4% | 0.3% |
| Multiracial | 4.7% | 3.9% | 2.8% |
| Hispanic | 20.6% | 28.9% | 18.2% |
Race / Ethnicity
- ALABAMA
- ALASKA
- ARIZONA
- ARKANSAS
- CALIFORNIA
- COLORADO
- CONNECTICUT
- DELAWARE
- FLORIDA
- GEORGIA
- HAWAII
- IDAHO
- ILLINOIS
- INDIANA
- IOWA
- KANSAS
- KENTUCKY
- LOUISIANA
- MAINE
- MARYLAND
- MASSACHUSETTS
- MICHIGAN
- MINNESOTA
- MISSISSIPPI
- MISSOURI
- MONTANA
- NEBRASKA
- NEVADA
- NEW HAMPSHIRE
- NEW JERSEY
- NEW MEXICO
- NEW YORK
- NORTH CAROLINA
- NORTH DAKOTA
- OHIO
- OKLAHOMA
- OREGON
- PENNSYLVANIA
- RHODE ISLAND
- SOUTH CAROLINA
- SOUTH DAKOTA
- TENNESSEE
- TEXAS
- UTAH
- VERMONT
- VIRGINIA
- WASHINGTON
- WEST VIRGINIA
- WISCONSIN
- WYOMING
