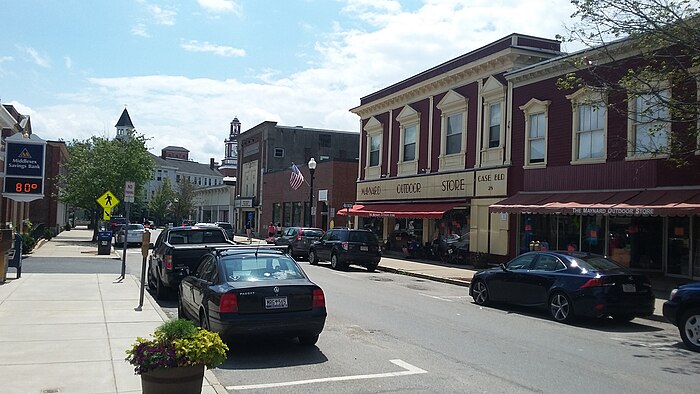
Moving to Maynard, Massachusetts
About Maynard, Massachusetts

Maynard is a town in Middlesex County, Massachusetts, United States. The town is located 22 miles west of Boston, in the MetroWest and Greater Boston region of Massachusetts and borders Acton, Concord, Stow and Sudbury. The town's population was 10,746 as of the 2020 United States Census.
Maynard is located on the Assabet River, a tributary of the Concord River. A large part of the Assabet River National Wildlife Refuge is located within the town, and the Assabet River Rail Trail connects the Refuge and downtown Maynard to the South Acton commuter rail station. Historic downtown Maynard is home to many shops, restaurants, galleries, a movie theater, and the former Assabet Woolen Mill, which produced wool fabrics from 1846 to 1950, including cloth for Union Army uniforms during the Civil War. Maynard was the headquarters location for Digital Equipment Corporation from 1957 to 1998. Owners of the former mill complex currently lease space to office and light-industry businesses.
Gender
| Gender | Maynard | Massachusetts | Country |
|---|---|---|---|
| Female | 51.6% | 51.5% | 50.8% |
| Male | 48.4% | 48.5% | 49.2% |
Gender
Household Income
| Income | Maynard | Massachusetts | Country |
|---|---|---|---|
| Less than $10,000 | 4.1% | 5% | 5.8% |
| $10,000 to $14,999 | 1.6% | 4.1% | 4.1% |
| $15,000 to $24,999 | 6.2% | 6.8% | 8.5% |
| $25,000 to $34,999 | 5.5% | 6.4% | 8.6% |
| $35,000 to $49,999 | 8.8% | 9% | 12.0% |
| $50,000 to $74,999 | 7.6% | 13.9% | 17.2% |
| $75,000 to $99,999 | 10.3% | 12% | 12.8% |
| $100,000 to $149,999 | 22% | 18% | 15.6% |
| $150,000 to $199,999 | 13.1% | 10.6% | 7.1% |
| $200,000 or more | 20.8% | 14.2% | 8.3% |
Education
| Education | Maynard | Massachusetts | Country |
|---|---|---|---|
| < 9th Grade | 3% | 3% | 5.0% |
| 9-12th Grade | 1% | 5% | 7.0% |
| High School or GED | 17% | 24% | 27.0% |
| Other College | 15% | 15% | 20.0% |
| Associate's Degree | 8% | 8% | 9% |
| Bachelor's Degree | 28% | 25% | 20.0% |
| Master's Degree | 19% | 14% | 9.0% |
| Professional Degree | 4% | 3% | 2.0% |
| Doctorate Degree | 5% | 3% | 1.0% |
Household Income
Education
Race / Ethnicity
| Ethnicity | Maynard | Massachusetts | Country |
|---|---|---|---|
| White | 86.5% | 70.8% | 60.1% |
| African American | 1.6% | 6.8% | 12.2% |
| American Indian | 0% | 0.1% | 0.6% |
| Asian | 4.2% | 6.7% | 5.6% |
| Hawaiian | 0% | 0% | 0.2% |
| Other | 0.4% | 0.8% | 0.3% |
| Multiracial | 4.4% | 2.7% | 2.8% |
| Hispanic | 2.9% | 12% | 18.2% |
Race / Ethnicity
- ALABAMA
- ALASKA
- ARIZONA
- ARKANSAS
- CALIFORNIA
- COLORADO
- CONNECTICUT
- DELAWARE
- FLORIDA
- GEORGIA
- HAWAII
- IDAHO
- ILLINOIS
- INDIANA
- IOWA
- KANSAS
- KENTUCKY
- LOUISIANA
- MAINE
- MARYLAND
- MASSACHUSETTS
- MICHIGAN
- MINNESOTA
- MISSISSIPPI
- MISSOURI
- MONTANA
- NEBRASKA
- NEVADA
- NEW HAMPSHIRE
- NEW JERSEY
- NEW MEXICO
- NEW YORK
- NORTH CAROLINA
- NORTH DAKOTA
- OHIO
- OKLAHOMA
- OREGON
- PENNSYLVANIA
- RHODE ISLAND
- SOUTH CAROLINA
- SOUTH DAKOTA
- TENNESSEE
- TEXAS
- UTAH
- VERMONT
- VIRGINIA
- WASHINGTON
- WEST VIRGINIA
- WISCONSIN
- WYOMING
