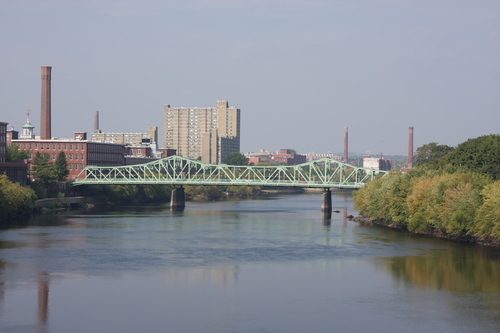
Moving to Lowell, Massachusetts
About Lowell, Massachusetts

Lowell () is a city in Massachusetts, United States. Alongside Cambridge, it is one of two traditional seats of Middlesex County. With an estimated population of 115,554 in 2020, it was the fifth most populous city in Massachusetts as of the last census, and the third most populous in the Boston metropolitan statistical area. The city is also part of a smaller Massachusetts statistical area, called Greater Lowell, and of New England's Merrimack Valley region.
Incorporated in 1826 to serve as a mill town, Lowell was named after Francis Cabot Lowell, a local figure in the Industrial Revolution. The city became known as the cradle of the American Industrial Revolution because of its textile mills and factories. Many of Lowell's historic manufacturing sites were later preserved by the National Park Service to create Lowell National Historical Park. During the Cambodian genocide (1975–1979), the city took in an influx of refugees, leading to a Cambodia Town and America's second-largest Cambodian-American population.
Lowell is home to two institutions of higher education. UMass Lowell, part of the University of Massachusetts system, has three campuses in the city. Middlesex Community College's two campuses are in Lowell and in the town of Bedford, Massachusetts. Arts facilities in the city include the Whistler House Museum of Art, the Merrimack Repertory Theatre, the Lowell Memorial Auditorium, and Sampas Pavilion. In sports, the city has a long tradition of boxing, hosting the annual New England Golden Gloves boxing tournament. The city has a baseball stadium, Edward A. LeLacheur Park, and a multipurpose indoor sports arena, the Tsongas Center, both of which have hosted collegiate and minor-league professional sports teams. Cawley Stadium, home of the Lowell High School Red Raiders, also played host to the Boston Patriots during their first season.
Gender
| Gender | Lowell | Massachusetts | Country |
|---|---|---|---|
| Female | 50.6% | 51.5% | 50.8% |
| Male | 49.4% | 48.5% | 49.2% |
Gender
Household Income
| Income | Lowell | Massachusetts | Country |
|---|---|---|---|
| Less than $10,000 | 7.7% | 5% | 5.8% |
| $10,000 to $14,999 | 7% | 4.1% | 4.1% |
| $15,000 to $24,999 | 9.6% | 6.8% | 8.5% |
| $25,000 to $34,999 | 7.1% | 6.4% | 8.6% |
| $35,000 to $49,999 | 10.7% | 9% | 12.0% |
| $50,000 to $74,999 | 15.3% | 13.9% | 17.2% |
| $75,000 to $99,999 | 15% | 12% | 12.8% |
| $100,000 to $149,999 | 15.7% | 18% | 15.6% |
| $150,000 to $199,999 | 6.9% | 10.6% | 7.1% |
| $200,000 or more | 5% | 14.2% | 8.3% |
Education
| Education | Lowell | Massachusetts | Country |
|---|---|---|---|
| < 9th Grade | 10% | 3% | 5.0% |
| 9-12th Grade | 7% | 5% | 7.0% |
| High School or GED | 32% | 24% | 27.0% |
| Other College | 17% | 15% | 20.0% |
| Associate's Degree | 7% | 8% | 9% |
| Bachelor's Degree | 16% | 25% | 20.0% |
| Master's Degree | 9% | 14% | 9.0% |
| Professional Degree | 1% | 3% | 2.0% |
| Doctorate Degree | 1% | 3% | 1.0% |
Household Income
Education
Race / Ethnicity
| Ethnicity | Lowell | Massachusetts | Country |
|---|---|---|---|
| White | 49.8% | 70.8% | 60.1% |
| African American | 8% | 6.8% | 12.2% |
| American Indian | 0.5% | 0.1% | 0.6% |
| Asian | 20.9% | 6.7% | 5.6% |
| Hawaiian | 0.1% | 0% | 0.2% |
| Other | 0.2% | 0.8% | 0.3% |
| Multiracial | 2.5% | 2.7% | 2.8% |
| Hispanic | 17.9% | 12% | 18.2% |
Race / Ethnicity
- ALABAMA
- ALASKA
- ARIZONA
- ARKANSAS
- CALIFORNIA
- COLORADO
- CONNECTICUT
- DELAWARE
- FLORIDA
- GEORGIA
- HAWAII
- IDAHO
- ILLINOIS
- INDIANA
- IOWA
- KANSAS
- KENTUCKY
- LOUISIANA
- MAINE
- MARYLAND
- MASSACHUSETTS
- MICHIGAN
- MINNESOTA
- MISSISSIPPI
- MISSOURI
- MONTANA
- NEBRASKA
- NEVADA
- NEW HAMPSHIRE
- NEW JERSEY
- NEW MEXICO
- NEW YORK
- NORTH CAROLINA
- NORTH DAKOTA
- OHIO
- OKLAHOMA
- OREGON
- PENNSYLVANIA
- RHODE ISLAND
- SOUTH CAROLINA
- SOUTH DAKOTA
- TENNESSEE
- TEXAS
- UTAH
- VERMONT
- VIRGINIA
- WASHINGTON
- WEST VIRGINIA
- WISCONSIN
- WYOMING
