Moving to Bridgewater, Massachusetts
About Bridgewater, Massachusetts
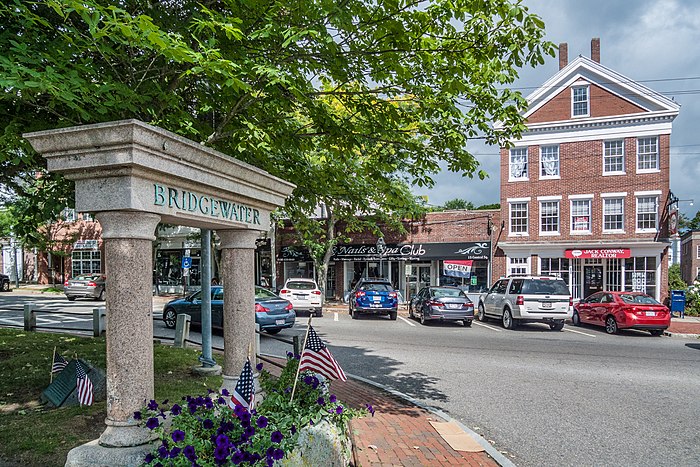
Bridgewater is a city in Plymouth County, Massachusetts, United States. As of the 2020 U.S. Census, the city’s population was 28,633. The historic city center of Bridgewater is located approximately 25 miles (40 km) south of Boston, Massachusetts and approximately 35 miles east of Providence, Rhode Island. The town of Bridgewater was formerly a census-designed-place (CDP) until 2010, when Bridgewater was granted city status. Today, Bridgewater is one of 13 municipalities in Massachusetts that have applied for and have been granted a city government while claiming ‘the town of’ in their official names.
Gender
| Gender | Bridgewater | Massachusetts | Country |
|---|---|---|---|
| Female | 52.9% | 51.5% | 50.8% |
| Male | 47.1% | 48.5% | 49.2% |
Gender
Household Income
| Income | Bridgewater | Massachusetts | Country |
|---|---|---|---|
| Less than $10,000 | 8.1% | 5% | 5.8% |
| $10,000 to $14,999 | 2.4% | 4.1% | 4.1% |
| $15,000 to $24,999 | 10.4% | 6.8% | 8.5% |
| $25,000 to $34,999 | 9.2% | 6.4% | 8.6% |
| $35,000 to $49,999 | 12.8% | 9% | 12.0% |
| $50,000 to $74,999 | 15.7% | 13.9% | 17.2% |
| $75,000 to $99,999 | 13.5% | 12% | 12.8% |
| $100,000 to $149,999 | 18.2% | 18% | 15.6% |
| $150,000 to $199,999 | 3.8% | 10.6% | 7.1% |
| $200,000 or more | 5.9% | 14.2% | 8.3% |
Education
| Education | Bridgewater | Massachusetts | Country |
|---|---|---|---|
| < 9th Grade | 2% | 3% | 5.0% |
| 9-12th Grade | 3% | 5% | 7.0% |
| High School or GED | 26% | 24% | 27.0% |
| Other College | 21% | 15% | 20.0% |
| Associate's Degree | 11% | 8% | 9% |
| Bachelor's Degree | 23% | 25% | 20.0% |
| Master's Degree | 9% | 14% | 9.0% |
| Professional Degree | 2% | 3% | 2.0% |
| Doctorate Degree | 3% | 3% | 1.0% |
Household Income
Education
Race / Ethnicity
| Ethnicity | Bridgewater | Massachusetts | Country |
|---|---|---|---|
| White | 78.5% | 70.8% | 60.1% |
| African American | 12.9% | 6.8% | 12.2% |
| American Indian | 0% | 0.1% | 0.6% |
| Asian | 1.5% | 6.7% | 5.6% |
| Hawaiian | 0.2% | 0% | 0.2% |
| Other | 1% | 0.8% | 0.3% |
| Multiracial | 2% | 2.7% | 2.8% |
| Hispanic | 3.9% | 12% | 18.2% |
Race / Ethnicity
- ALABAMA
- ALASKA
- ARIZONA
- ARKANSAS
- CALIFORNIA
- COLORADO
- CONNECTICUT
- DELAWARE
- FLORIDA
- GEORGIA
- HAWAII
- IDAHO
- ILLINOIS
- INDIANA
- IOWA
- KANSAS
- KENTUCKY
- LOUISIANA
- MAINE
- MARYLAND
- MASSACHUSETTS
- MICHIGAN
- MINNESOTA
- MISSISSIPPI
- MISSOURI
- MONTANA
- NEBRASKA
- NEVADA
- NEW HAMPSHIRE
- NEW JERSEY
- NEW MEXICO
- NEW YORK
- NORTH CAROLINA
- NORTH DAKOTA
- OHIO
- OKLAHOMA
- OREGON
- PENNSYLVANIA
- RHODE ISLAND
- SOUTH CAROLINA
- SOUTH DAKOTA
- TENNESSEE
- TEXAS
- UTAH
- VERMONT
- VIRGINIA
- WASHINGTON
- WEST VIRGINIA
- WISCONSIN
- WYOMING