Moving to Bangor, Maine
About Bangor, Maine

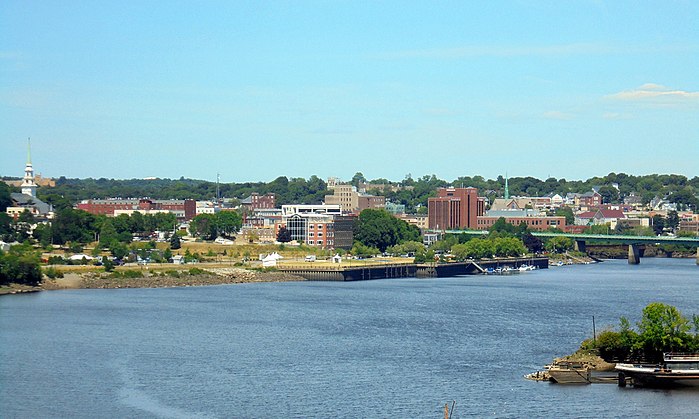
Bangor ( BANG-gor) is a city in and the county seat of Penobscot County, Maine, United States. The city proper has a population of 31,753, making it the state's third-most populous city, behind Portland (68,408) and Lewiston (37,121). Bangor is known as the "Queen City."
Modern Bangor was established in the mid-19th century with the lumber and shipbuilding industries. Lying on the Penobscot River, logs could be floated downstream from the Maine North Woods and processed at the city's water-powered sawmills, then shipped from Bangor's port to the Atlantic Ocean 30 miles (48 km) downstream, and from there to any port in the world. Evidence of this is still visible in the lumber barons' elaborate Greek Revival and Victorian mansions and the 31-foot-high (9.4 m) statue of Paul Bunyan. Today, Bangor's economy is based on services and retail, healthcare, and education.
Bangor has a port of entry at Bangor International Airport, also home to the Bangor Air National Guard Base. Historically Bangor was an important stopover on the Great Circle Air Route between the U.S. East Coast and Europe.
Gender
| Gender | Bangor | Maine | Country |
|---|---|---|---|
| Female | 52.6% | 51% | 50.8% |
| Male | 47.4% | 49% | 49.2% |
Gender
Household Income
| Income | Bangor | Maine | Country |
|---|---|---|---|
| Less than $10,000 | 7.7% | 5.3% | 5.8% |
| $10,000 to $14,999 | 6.4% | 4.9% | 4.1% |
| $15,000 to $24,999 | 12.4% | 9.7% | 8.5% |
| $25,000 to $34,999 | 11.8% | 9.3% | 8.6% |
| $35,000 to $49,999 | 14.5% | 13.1% | 12.0% |
| $50,000 to $74,999 | 17.4% | 18.5% | 17.2% |
| $75,000 to $99,999 | 10.2% | 13.8% | 12.8% |
| $100,000 to $149,999 | 11.5% | 15% | 15.6% |
| $150,000 to $199,999 | 3.8% | 5.5% | 7.1% |
| $200,000 or more | 4.3% | 4.9% | 8.3% |
Education
| Education | Bangor | Maine | Country |
|---|---|---|---|
| < 9th Grade | 0% | 3% | 5.0% |
| 9-12th Grade | 4% | 5% | 7.0% |
| High School or GED | 30% | 31% | 27.0% |
| Other College | 19% | 19% | 20.0% |
| Associate's Degree | 10% | 10% | 9% |
| Bachelor's Degree | 21% | 20% | 20.0% |
| Master's Degree | 11% | 9% | 9.0% |
| Professional Degree | 3% | 2% | 2.0% |
| Doctorate Degree | 2% | 1% | 1.0% |
Household Income
Education
Race / Ethnicity
| Ethnicity | Bangor | Maine | Country |
|---|---|---|---|
| White | 89.6% | 92.6% | 60.1% |
| African American | 1.8% | 1.3% | 12.2% |
| American Indian | 0.9% | 0.6% | 0.6% |
| Asian | 1.6% | 1.1% | 5.6% |
| Hawaiian | 0% | 0% | 0.2% |
| Other | 0.6% | 0.2% | 0.3% |
| Multiracial | 2.8% | 2.4% | 2.8% |
| Hispanic | 2.7% | 1.7% | 18.2% |
Race / Ethnicity
- ALABAMA
- ALASKA
- ARIZONA
- ARKANSAS
- CALIFORNIA
- COLORADO
- CONNECTICUT
- DELAWARE
- FLORIDA
- GEORGIA
- HAWAII
- IDAHO
- ILLINOIS
- INDIANA
- IOWA
- KANSAS
- KENTUCKY
- LOUISIANA
- MAINE
- MARYLAND
- MASSACHUSETTS
- MICHIGAN
- MINNESOTA
- MISSISSIPPI
- MISSOURI
- MONTANA
- NEBRASKA
- NEVADA
- NEW HAMPSHIRE
- NEW JERSEY
- NEW MEXICO
- NEW YORK
- NORTH CAROLINA
- NORTH DAKOTA
- OHIO
- OKLAHOMA
- OREGON
- PENNSYLVANIA
- RHODE ISLAND
- SOUTH CAROLINA
- SOUTH DAKOTA
- TENNESSEE
- TEXAS
- UTAH
- VERMONT
- VIRGINIA
- WASHINGTON
- WEST VIRGINIA
- WISCONSIN
- WYOMING
