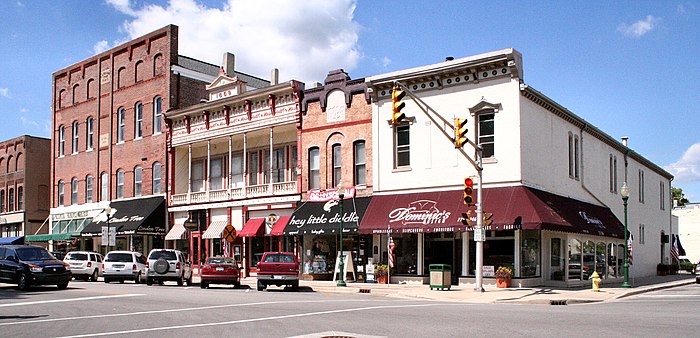
Moving to Noblesville, Indiana
About Noblesville, Indiana

Noblesville is a city in and the county seat of Hamilton County, Indiana, United States, a part of the north Indianapolis suburbs along the White River. The population was 69,604 at the 2020 census, making it the state's 10th most populous city, up from 14th in 2010. The city is part of Delaware, Fall Creek, Noblesville, and Wayne townships.
Noblesville is home to Ruoff Music Center (formerly Klipsch Music Center and Deer Creek Music Center), the Indianapolis metro area’s primary outdoor music venue. Since its opening in 1989, the nearly 25,000-seat amphitheater has been a popular stop for many touring musicians, consistently ranking first (or in the top three) among outdoor music venues in the world, for ticket sales, according to Pollstar.
Gender
| Gender | Noblesville | Indiana | Country |
|---|---|---|---|
| Female | 50.4% | 50.7% | 50.8% |
| Male | 49.6% | 49.3% | 49.2% |
Gender
Household Income
| Income | Noblesville | Indiana | Country |
|---|---|---|---|
| Less than $10,000 | 2.9% | 5.9% | 5.8% |
| $10,000 to $14,999 | 1.3% | 4.1% | 4.1% |
| $15,000 to $24,999 | 5.3% | 9.5% | 8.5% |
| $25,000 to $34,999 | 6.3% | 9.9% | 8.6% |
| $35,000 to $49,999 | 11.3% | 13.6% | 12.0% |
| $50,000 to $74,999 | 18.3% | 19.2% | 17.2% |
| $75,000 to $99,999 | 12.6% | 13.5% | 12.8% |
| $100,000 to $149,999 | 24.5% | 14.7% | 15.6% |
| $150,000 to $199,999 | 9.5% | 5.2% | 7.1% |
| $200,000 or more | 8% | 4.4% | 8.3% |
Education
| Education | Noblesville | Indiana | Country |
|---|---|---|---|
| < 9th Grade | -1% | 4% | 5.0% |
| 9-12th Grade | 3% | 7% | 7.0% |
| High School or GED | 19% | 33% | 27.0% |
| Other College | 20% | 20% | 20.0% |
| Associate's Degree | 9% | 9% | 9% |
| Bachelor's Degree | 34% | 17% | 20.0% |
| Master's Degree | 12% | 7% | 9.0% |
| Professional Degree | 3% | 2% | 2.0% |
| Doctorate Degree | 1% | 1% | 1.0% |
Household Income
Education
Race / Ethnicity
| Ethnicity | Noblesville | Indiana | Country |
|---|---|---|---|
| White | 88.4% | 78.4% | 60.1% |
| African American | 3.6% | 9.3% | 12.2% |
| American Indian | 0.1% | 0.2% | 0.6% |
| Asian | 2.1% | 2.3% | 5.6% |
| Hawaiian | 0% | 0% | 0.2% |
| Other | 0.3% | 0.3% | 0.3% |
| Multiracial | 2.6% | 2.4% | 2.8% |
| Hispanic | 2.9% | 7.1% | 18.2% |
Race / Ethnicity
- ALABAMA
- ALASKA
- ARIZONA
- ARKANSAS
- CALIFORNIA
- COLORADO
- CONNECTICUT
- DELAWARE
- FLORIDA
- GEORGIA
- HAWAII
- IDAHO
- ILLINOIS
- INDIANA
- IOWA
- KANSAS
- KENTUCKY
- LOUISIANA
- MAINE
- MARYLAND
- MASSACHUSETTS
- MICHIGAN
- MINNESOTA
- MISSISSIPPI
- MISSOURI
- MONTANA
- NEBRASKA
- NEVADA
- NEW HAMPSHIRE
- NEW JERSEY
- NEW MEXICO
- NEW YORK
- NORTH CAROLINA
- NORTH DAKOTA
- OHIO
- OKLAHOMA
- OREGON
- PENNSYLVANIA
- RHODE ISLAND
- SOUTH CAROLINA
- SOUTH DAKOTA
- TENNESSEE
- TEXAS
- UTAH
- VERMONT
- VIRGINIA
- WASHINGTON
- WEST VIRGINIA
- WISCONSIN
- WYOMING
