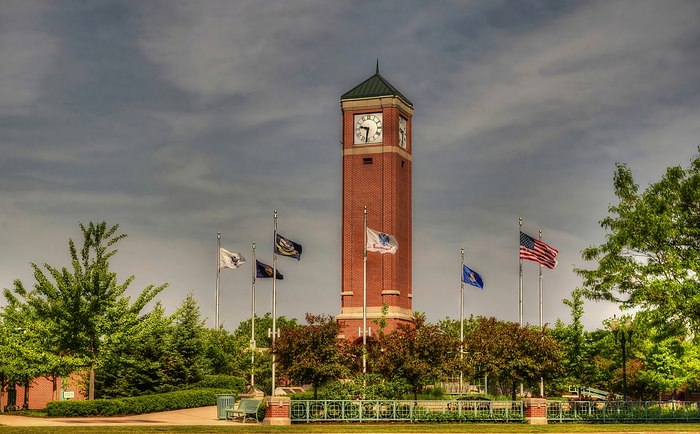
Moving to Schaumburg, Illinois
About Schaumburg, Illinois

Schaumburg ( SHAWM-burg) is a village in Cook and DuPage counties in the U.S. state of Illinois. Per the 2020 census, the population was 78,723, making Schaumburg the most populous incorporated village in the United States. Schaumburg is around 28 miles (45 km) northwest of the Chicago Loop and 10 miles (16 km) northwest of O'Hare International Airport. It is part of the Golden Corridor.
Schaumburg's transition from a rural community to a suburban city began with Alfred Campanelli's first large-scale suburban-style development in 1959 and Woodfield Mall's opening in 1971. Schaumburg is bordered by Hoffman Estates and Palatine to the north, Inverness in northwest, Rolling Meadows to the northeast, Elk Grove Village to the southeast, Roselle to the south, Hanover Park to the southwest, and Streamwood to the west.
Gender
| Gender | Schaumburg | Illinois | Country |
|---|---|---|---|
| Female | 51.4% | 50.9% | 50.8% |
| Male | 48.6% | 49.1% | 49.2% |
Gender
Household Income
| Income | Schaumburg | Illinois | Country |
|---|---|---|---|
| Less than $10,000 | 3.3% | 6.1% | 5.8% |
| $10,000 to $14,999 | 2.5% | 3.7% | 4.1% |
| $15,000 to $24,999 | 5.1% | 8.1% | 8.5% |
| $25,000 to $34,999 | 5.2% | 8.1% | 8.6% |
| $35,000 to $49,999 | 10% | 11.2% | 12.0% |
| $50,000 to $74,999 | 18.5% | 16.7% | 17.2% |
| $75,000 to $99,999 | 17.3% | 12.9% | 12.8% |
| $100,000 to $149,999 | 19.8% | 16.6% | 15.6% |
| $150,000 to $199,999 | 10.2% | 7.8% | 7.1% |
| $200,000 or more | 8.1% | 8.8% | 8.3% |
Education
| Education | Schaumburg | Illinois | Country |
|---|---|---|---|
| < 9th Grade | 2% | 5% | 5.0% |
| 9-12th Grade | 2% | 6% | 7.0% |
| High School or GED | 20% | 26% | 27.0% |
| Other College | 19% | 20% | 20.0% |
| Associate's Degree | 7% | 8% | 9% |
| Bachelor's Degree | 30% | 22% | 20.0% |
| Master's Degree | 16% | 10% | 9.0% |
| Professional Degree | 2% | 2% | 2.0% |
| Doctorate Degree | 2% | 1% | 1.0% |
Household Income
Education
Race / Ethnicity
| Ethnicity | Schaumburg | Illinois | Country |
|---|---|---|---|
| White | 55.9% | 60.8% | 60.1% |
| African American | 5.7% | 13.9% | 12.2% |
| American Indian | 0.2% | 0.1% | 0.6% |
| Asian | 24.8% | 5.5% | 5.6% |
| Hawaiian | 0% | 0% | 0.2% |
| Other | 0.4% | 0.2% | 0.3% |
| Multiracial | 2.6% | 2.2% | 2.8% |
| Hispanic | 10.4% | 17.2% | 18.2% |
Race / Ethnicity
- ALABAMA
- ALASKA
- ARIZONA
- ARKANSAS
- CALIFORNIA
- COLORADO
- CONNECTICUT
- DELAWARE
- FLORIDA
- GEORGIA
- HAWAII
- IDAHO
- ILLINOIS
- INDIANA
- IOWA
- KANSAS
- KENTUCKY
- LOUISIANA
- MAINE
- MARYLAND
- MASSACHUSETTS
- MICHIGAN
- MINNESOTA
- MISSISSIPPI
- MISSOURI
- MONTANA
- NEBRASKA
- NEVADA
- NEW HAMPSHIRE
- NEW JERSEY
- NEW MEXICO
- NEW YORK
- NORTH CAROLINA
- NORTH DAKOTA
- OHIO
- OKLAHOMA
- OREGON
- PENNSYLVANIA
- RHODE ISLAND
- SOUTH CAROLINA
- SOUTH DAKOTA
- TENNESSEE
- TEXAS
- UTAH
- VERMONT
- VIRGINIA
- WASHINGTON
- WEST VIRGINIA
- WISCONSIN
- WYOMING
