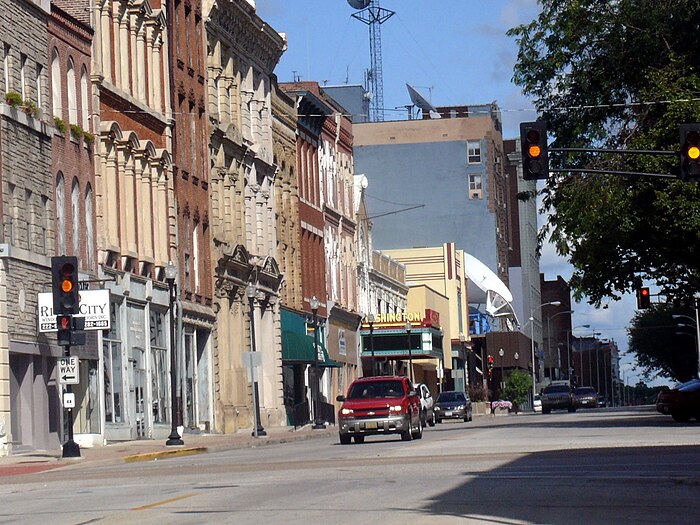
Moving to Quincy, Illinois
About Quincy, Illinois

Quincy ( KWIN-see) is a city in and the county seat of Adams County, Illinois, United States, located on the Mississippi River. The population was 39,463 as of the 2020 census, down from 40,633 in 2010. The Quincy micropolitan area had 114,649 residents.
Known as Illinois's "Gem City", Quincy was a thriving transportation center as riverboats and rail service linked the city to many destinations west and along the river during the 19th century. It was Illinois' second-largest city, surpassing Peoria in 1870. The city has several historic districts, including the Downtown Quincy Historic District and the South Side German Historic District, which display the architecture of Quincy's many German immigrants from the late 19th century.
Gender
| Gender | Quincy | Illinois | Country |
|---|---|---|---|
| Female | 52% | 50.9% | 50.8% |
| Male | 48% | 49.1% | 49.2% |
Gender
Household Income
| Income | Quincy | Illinois | Country |
|---|---|---|---|
| Less than $10,000 | 7.6% | 6.1% | 5.8% |
| $10,000 to $14,999 | 4.1% | 3.7% | 4.1% |
| $15,000 to $24,999 | 12.6% | 8.1% | 8.5% |
| $25,000 to $34,999 | 11.3% | 8.1% | 8.6% |
| $35,000 to $49,999 | 16.9% | 11.2% | 12.0% |
| $50,000 to $74,999 | 18.5% | 16.7% | 17.2% |
| $75,000 to $99,999 | 11.5% | 12.9% | 12.8% |
| $100,000 to $149,999 | 10.4% | 16.6% | 15.6% |
| $150,000 to $199,999 | 3.4% | 7.8% | 7.1% |
| $200,000 or more | 3.7% | 8.8% | 8.3% |
Education
| Education | Quincy | Illinois | Country |
|---|---|---|---|
| < 9th Grade | 2% | 5% | 5.0% |
| 9-12th Grade | 7% | 6% | 7.0% |
| High School or GED | 33% | 26% | 27.0% |
| Other College | 25% | 20% | 20.0% |
| Associate's Degree | 8% | 8% | 9% |
| Bachelor's Degree | 16% | 22% | 20.0% |
| Master's Degree | 7% | 10% | 9.0% |
| Professional Degree | 1% | 2% | 2.0% |
| Doctorate Degree | 1% | 1% | 1.0% |
Household Income
Education
Race / Ethnicity
| Ethnicity | Quincy | Illinois | Country |
|---|---|---|---|
| White | 87.7% | 60.8% | 60.1% |
| African American | 6.4% | 13.9% | 12.2% |
| American Indian | 0.1% | 0.1% | 0.6% |
| Asian | 0.7% | 5.5% | 5.6% |
| Hawaiian | 0% | 0% | 0.2% |
| Other | 0.2% | 0.2% | 0.3% |
| Multiracial | 2.9% | 2.2% | 2.8% |
| Hispanic | 2% | 17.2% | 18.2% |
Race / Ethnicity
- ALABAMA
- ALASKA
- ARIZONA
- ARKANSAS
- CALIFORNIA
- COLORADO
- CONNECTICUT
- DELAWARE
- FLORIDA
- GEORGIA
- HAWAII
- IDAHO
- ILLINOIS
- INDIANA
- IOWA
- KANSAS
- KENTUCKY
- LOUISIANA
- MAINE
- MARYLAND
- MASSACHUSETTS
- MICHIGAN
- MINNESOTA
- MISSISSIPPI
- MISSOURI
- MONTANA
- NEBRASKA
- NEVADA
- NEW HAMPSHIRE
- NEW JERSEY
- NEW MEXICO
- NEW YORK
- NORTH CAROLINA
- NORTH DAKOTA
- OHIO
- OKLAHOMA
- OREGON
- PENNSYLVANIA
- RHODE ISLAND
- SOUTH CAROLINA
- SOUTH DAKOTA
- TENNESSEE
- TEXAS
- UTAH
- VERMONT
- VIRGINIA
- WASHINGTON
- WEST VIRGINIA
- WISCONSIN
- WYOMING
