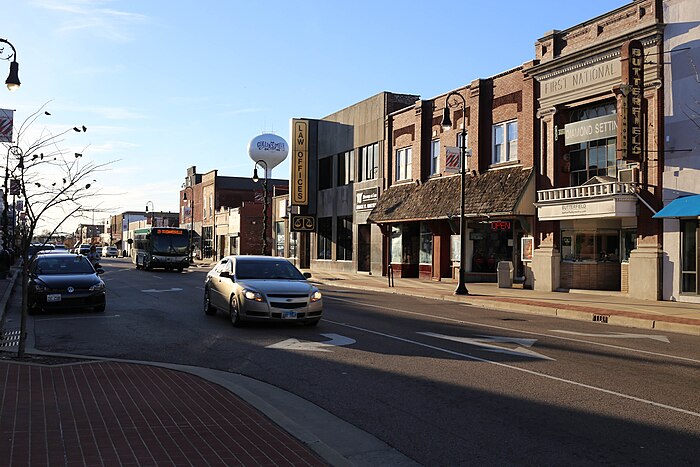
Moving to Collinsville, Illinois
About Collinsville, Illinois

Collinsville is a city located mainly in Madison County and partially in St. Clair County, Illinois, United States. As of the 2020 census, the city had a population of 24,366. Collinsville is approximately 14 miles (23 km) east of St. Louis, Missouri, and is part of that city's Metro East area.
Collinsville is the location of Cahokia Mounds State Historic Site, a National Historic Landmark and UNESCO World Heritage Site. This prehistoric urban complex is estimated to have had a population of thousands at its peak, long before European exploration in the area. The city is also known for the Brooks Catsup Bottle Water Tower, the world's largest ketchup bottle, and is billed as the world's horseradish capital.
Gender
| Gender | Collinsville | Illinois | Country |
|---|---|---|---|
| Female | 53.5% | 50.9% | 50.8% |
| Male | 46.5% | 49.1% | 49.2% |
Gender
Household Income
| Income | Collinsville | Illinois | Country |
|---|---|---|---|
| Less than $10,000 | 4.7% | 6.1% | 5.8% |
| $10,000 to $14,999 | 4.7% | 3.7% | 4.1% |
| $15,000 to $24,999 | 10.3% | 8.1% | 8.5% |
| $25,000 to $34,999 | 10.6% | 8.1% | 8.6% |
| $35,000 to $49,999 | 12.2% | 11.2% | 12.0% |
| $50,000 to $74,999 | 20.1% | 16.7% | 17.2% |
| $75,000 to $99,999 | 12.1% | 12.9% | 12.8% |
| $100,000 to $149,999 | 15.7% | 16.6% | 15.6% |
| $150,000 to $199,999 | 5.9% | 7.8% | 7.1% |
| $200,000 or more | 3.7% | 8.8% | 8.3% |
Education
| Education | Collinsville | Illinois | Country |
|---|---|---|---|
| < 9th Grade | 2% | 5% | 5.0% |
| 9-12th Grade | 4% | 6% | 7.0% |
| High School or GED | 30% | 26% | 27.0% |
| Other College | 27% | 20% | 20.0% |
| Associate's Degree | 10% | 8% | 9% |
| Bachelor's Degree | 17% | 22% | 20.0% |
| Master's Degree | 8% | 10% | 9.0% |
| Professional Degree | 1% | 2% | 2.0% |
| Doctorate Degree | 1% | 1% | 1.0% |
Household Income
Education
Race / Ethnicity
| Ethnicity | Collinsville | Illinois | Country |
|---|---|---|---|
| White | 75.6% | 60.8% | 60.1% |
| African American | 14.1% | 13.9% | 12.2% |
| American Indian | 0.2% | 0.1% | 0.6% |
| Asian | 2% | 5.5% | 5.6% |
| Hawaiian | 0% | 0% | 0.2% |
| Other | 0% | 0.2% | 0.3% |
| Multiracial | 2% | 2.2% | 2.8% |
| Hispanic | 6.1% | 17.2% | 18.2% |
Race / Ethnicity
- ALABAMA
- ALASKA
- ARIZONA
- ARKANSAS
- CALIFORNIA
- COLORADO
- CONNECTICUT
- DELAWARE
- FLORIDA
- GEORGIA
- HAWAII
- IDAHO
- ILLINOIS
- INDIANA
- IOWA
- KANSAS
- KENTUCKY
- LOUISIANA
- MAINE
- MARYLAND
- MASSACHUSETTS
- MICHIGAN
- MINNESOTA
- MISSISSIPPI
- MISSOURI
- MONTANA
- NEBRASKA
- NEVADA
- NEW HAMPSHIRE
- NEW JERSEY
- NEW MEXICO
- NEW YORK
- NORTH CAROLINA
- NORTH DAKOTA
- OHIO
- OKLAHOMA
- OREGON
- PENNSYLVANIA
- RHODE ISLAND
- SOUTH CAROLINA
- SOUTH DAKOTA
- TENNESSEE
- TEXAS
- UTAH
- VERMONT
- VIRGINIA
- WASHINGTON
- WEST VIRGINIA
- WISCONSIN
- WYOMING
