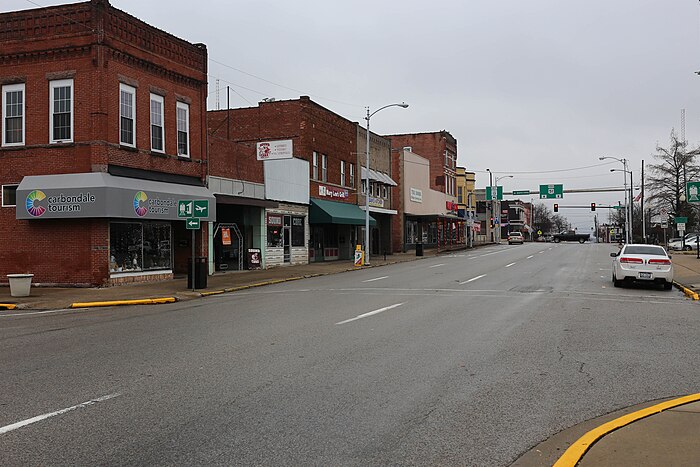
Moving to Carbondale, Illinois
About Carbondale, Illinois

Carbondale is a city in Jackson County, Illinois, United States, within the Southern Illinois region informally known as "Little Egypt". As of the 2020 census, the city had a population of 25,083, making it the most populous city in Southern Illinois outside the Metro East region of Greater St. Louis.
Carbondale was established in 1853 and developed as a crossroads of the railroad industry. Today, the major roadways of Illinois Route 13 and U.S. Route 51 intersect in the city. The city is located 96 miles (154 km) southeast of St. Louis on the northern edge of the Shawnee National Forest. It is the home of the main campus of Southern Illinois University.
Gender
| Gender | Carbondale | Illinois | Country |
|---|---|---|---|
| Female | 49.8% | 50.9% | 50.8% |
| Male | 50.2% | 49.1% | 49.2% |
Gender
Household Income
| Income | Carbondale | Illinois | Country |
|---|---|---|---|
| Less than $10,000 | 23% | 6.1% | 5.8% |
| $10,000 to $14,999 | 9.3% | 3.7% | 4.1% |
| $15,000 to $24,999 | 19.8% | 8.1% | 8.5% |
| $25,000 to $34,999 | 6.3% | 8.1% | 8.6% |
| $35,000 to $49,999 | 14.1% | 11.2% | 12.0% |
| $50,000 to $74,999 | 7.6% | 16.7% | 17.2% |
| $75,000 to $99,999 | 7.5% | 12.9% | 12.8% |
| $100,000 to $149,999 | 5.5% | 16.6% | 15.6% |
| $150,000 to $199,999 | 4.4% | 7.8% | 7.1% |
| $200,000 or more | 2.5% | 8.8% | 8.3% |
Education
| Education | Carbondale | Illinois | Country |
|---|---|---|---|
| < 9th Grade | 2% | 5% | 5.0% |
| 9-12th Grade | 3% | 6% | 7.0% |
| High School or GED | 16% | 26% | 27.0% |
| Other College | 25% | 20% | 20.0% |
| Associate's Degree | 7% | 8% | 9% |
| Bachelor's Degree | 18% | 22% | 20.0% |
| Master's Degree | 19% | 10% | 9.0% |
| Professional Degree | 3% | 2% | 2.0% |
| Doctorate Degree | 7% | 1% | 1.0% |
Household Income
Education
Race / Ethnicity
| Ethnicity | Carbondale | Illinois | Country |
|---|---|---|---|
| White | 58% | 60.8% | 60.1% |
| African American | 26.8% | 13.9% | 12.2% |
| American Indian | 0.3% | 0.1% | 0.6% |
| Asian | 5.7% | 5.5% | 5.6% |
| Hawaiian | 0.1% | 0% | 0.2% |
| Other | 0.5% | 0.2% | 0.3% |
| Multiracial | 3% | 2.2% | 2.8% |
| Hispanic | 5.6% | 17.2% | 18.2% |
Race / Ethnicity
- ALABAMA
- ALASKA
- ARIZONA
- ARKANSAS
- CALIFORNIA
- COLORADO
- CONNECTICUT
- DELAWARE
- FLORIDA
- GEORGIA
- HAWAII
- IDAHO
- ILLINOIS
- INDIANA
- IOWA
- KANSAS
- KENTUCKY
- LOUISIANA
- MAINE
- MARYLAND
- MASSACHUSETTS
- MICHIGAN
- MINNESOTA
- MISSISSIPPI
- MISSOURI
- MONTANA
- NEBRASKA
- NEVADA
- NEW HAMPSHIRE
- NEW JERSEY
- NEW MEXICO
- NEW YORK
- NORTH CAROLINA
- NORTH DAKOTA
- OHIO
- OKLAHOMA
- OREGON
- PENNSYLVANIA
- RHODE ISLAND
- SOUTH CAROLINA
- SOUTH DAKOTA
- TENNESSEE
- TEXAS
- UTAH
- VERMONT
- VIRGINIA
- WASHINGTON
- WEST VIRGINIA
- WISCONSIN
- WYOMING
