Moving to Belvidere, Illinois
About Belvidere, Illinois

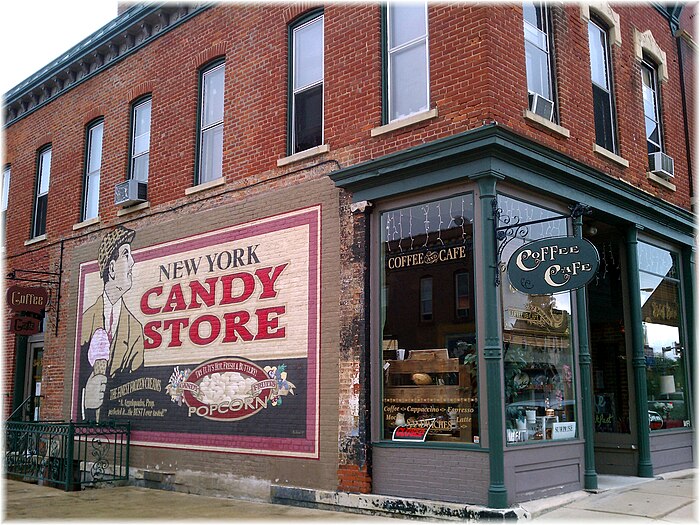
Belvidere is a city in and the county seat of Boone County, Illinois, United States. It is settled on the Kishwaukee River in far northern Illinois. Known as the 'City of Murals', Belvidere is home to several public art installations throughout the North and South State Street historic districts, which are on the National Register of Historic Places. These historic districts are home to places like the Boone County Museum of History, the Funderburg House Museum, several restaurants and bars, and antique and boutique stores. Popular festivities like Heritage Days are held yearly. The population was 25,339 as of the 2020 census. Belvidere is part of the Rockford metropolitan area.
Gender
| Gender | Belvidere | Illinois | Country |
|---|---|---|---|
| Female | 51.3% | 50.9% | 50.8% |
| Male | 48.7% | 49.1% | 49.2% |
Gender
Household Income
| Income | Belvidere | Illinois | Country |
|---|---|---|---|
| Less than $10,000 | 5.2% | 6.1% | 5.8% |
| $10,000 to $14,999 | 4.2% | 3.7% | 4.1% |
| $15,000 to $24,999 | 12.1% | 8.1% | 8.5% |
| $25,000 to $34,999 | 12.2% | 8.1% | 8.6% |
| $35,000 to $49,999 | 14.4% | 11.2% | 12.0% |
| $50,000 to $74,999 | 17.9% | 16.7% | 17.2% |
| $75,000 to $99,999 | 12.8% | 12.9% | 12.8% |
| $100,000 to $149,999 | 15.4% | 16.6% | 15.6% |
| $150,000 to $199,999 | 5.1% | 7.8% | 7.1% |
| $200,000 or more | 0.7% | 8.8% | 8.3% |
Education
| Education | Belvidere | Illinois | Country |
|---|---|---|---|
| < 9th Grade | 9% | 5% | 5.0% |
| 9-12th Grade | 11% | 6% | 7.0% |
| High School or GED | 35% | 26% | 27.0% |
| Other College | 22% | 20% | 20.0% |
| Associate's Degree | 8% | 8% | 9% |
| Bachelor's Degree | 9% | 22% | 20.0% |
| Master's Degree | 5% | 10% | 9.0% |
| Professional Degree | 1% | 2% | 2.0% |
| Doctorate Degree | 0% | 1% | 1.0% |
Household Income
Education
Race / Ethnicity
| Ethnicity | Belvidere | Illinois | Country |
|---|---|---|---|
| White | 58.8% | 60.8% | 60.1% |
| African American | 1.8% | 13.9% | 12.2% |
| American Indian | 0% | 0.1% | 0.6% |
| Asian | 0.8% | 5.5% | 5.6% |
| Hawaiian | 0% | 0% | 0.2% |
| Other | 0% | 0.2% | 0.3% |
| Multiracial | 1.6% | 2.2% | 2.8% |
| Hispanic | 37.1% | 17.2% | 18.2% |
Race / Ethnicity
- ALABAMA
- ALASKA
- ARIZONA
- ARKANSAS
- CALIFORNIA
- COLORADO
- CONNECTICUT
- DELAWARE
- FLORIDA
- GEORGIA
- HAWAII
- IDAHO
- ILLINOIS
- INDIANA
- IOWA
- KANSAS
- KENTUCKY
- LOUISIANA
- MAINE
- MARYLAND
- MASSACHUSETTS
- MICHIGAN
- MINNESOTA
- MISSISSIPPI
- MISSOURI
- MONTANA
- NEBRASKA
- NEVADA
- NEW HAMPSHIRE
- NEW JERSEY
- NEW MEXICO
- NEW YORK
- NORTH CAROLINA
- NORTH DAKOTA
- OHIO
- OKLAHOMA
- OREGON
- PENNSYLVANIA
- RHODE ISLAND
- SOUTH CAROLINA
- SOUTH DAKOTA
- TENNESSEE
- TEXAS
- UTAH
- VERMONT
- VIRGINIA
- WASHINGTON
- WEST VIRGINIA
- WISCONSIN
- WYOMING
