Moving to Waialua, Hawaii
About Waialua, Hawaii

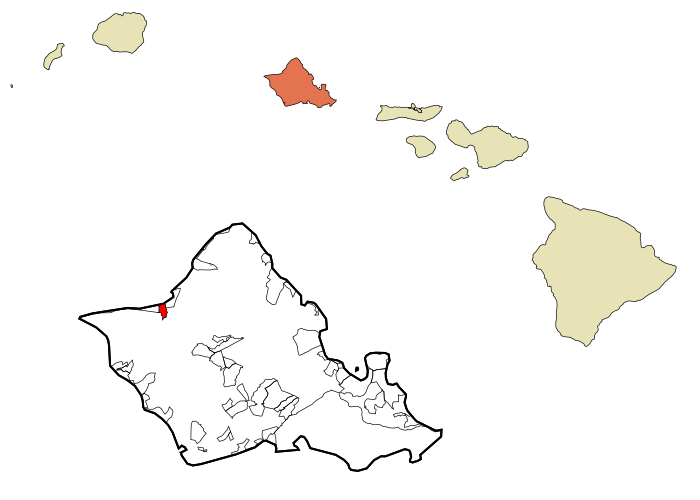
Waialua (Hawaiian pronunciation: [vɐjəˈluwə]) is a census-designated place and North Shore community in the Waialua District on the island of Oʻahu, City & County of Honolulu, Hawaii, United States. As of the 2020 census, the CDP had a population of 4,062.
Waialua was one of the six original districts of ancient Hawaii on the island, known as moku. Waialua is a former (sugar) mill town and residential area, quite different in its quiet ambiance from nearby Haleʻiwa, which is more commercial and tourist oriented. The Waialua Sugar Mill is the center of this town and the historical base of its plantation history.
The U.S. postal code for Waialua is 96791.
Gender
| Gender | Waialua | Hawaii | Country |
|---|---|---|---|
| Female | 50% | 49.8% | 50.8% |
| Male | 50% | 50.2% | 49.2% |
Gender
Household Income
| Income | Waialua | Hawaii | Country |
|---|---|---|---|
| Less than $10,000 | 10.2% | 4.9% | 5.8% |
| $10,000 to $14,999 | 1.5% | 2.7% | 4.1% |
| $15,000 to $24,999 | 7% | 5.5% | 8.5% |
| $25,000 to $34,999 | 8.2% | 6.3% | 8.6% |
| $35,000 to $49,999 | 8% | 9.7% | 12.0% |
| $50,000 to $74,999 | 12.5% | 16.1% | 17.2% |
| $75,000 to $99,999 | 13.1% | 13.7% | 12.8% |
| $100,000 to $149,999 | 30% | 19.5% | 15.6% |
| $150,000 to $199,999 | 6.2% | 10.5% | 7.1% |
| $200,000 or more | 3.3% | 11.1% | 8.3% |
Education
| Education | Waialua | Hawaii | Country |
|---|---|---|---|
| < 9th Grade | 6% | 3% | 5.0% |
| 9-12th Grade | 4% | 4% | 7.0% |
| High School or GED | 35% | 27% | 27.0% |
| Other College | 19% | 21% | 20.0% |
| Associate's Degree | 7% | 11% | 9% |
| Bachelor's Degree | 22% | 22% | 20.0% |
| Master's Degree | 6% | 8% | 9.0% |
| Professional Degree | 1% | 2% | 2.0% |
| Doctorate Degree | 0% | 2% | 1.0% |
Household Income
Education
Race / Ethnicity
| Ethnicity | Waialua | Hawaii | Country |
|---|---|---|---|
| White | 22.9% | 21.6% | 60.1% |
| African American | 0% | 1.8% | 12.2% |
| American Indian | 0% | 0.1% | 0.6% |
| Asian | 35.9% | 36.8% | 5.6% |
| Hawaiian | 5.9% | 9.7% | 0.2% |
| Other | 0.3% | 0.2% | 0.3% |
| Multiracial | 19.6% | 19.2% | 2.8% |
| Hispanic | 15.2% | 10.7% | 18.2% |
Race / Ethnicity
- ALABAMA
- ALASKA
- ARIZONA
- ARKANSAS
- CALIFORNIA
- COLORADO
- CONNECTICUT
- DELAWARE
- FLORIDA
- GEORGIA
- HAWAII
- IDAHO
- ILLINOIS
- INDIANA
- IOWA
- KANSAS
- KENTUCKY
- LOUISIANA
- MAINE
- MARYLAND
- MASSACHUSETTS
- MICHIGAN
- MINNESOTA
- MISSISSIPPI
- MISSOURI
- MONTANA
- NEBRASKA
- NEVADA
- NEW HAMPSHIRE
- NEW JERSEY
- NEW MEXICO
- NEW YORK
- NORTH CAROLINA
- NORTH DAKOTA
- OHIO
- OKLAHOMA
- OREGON
- PENNSYLVANIA
- RHODE ISLAND
- SOUTH CAROLINA
- SOUTH DAKOTA
- TENNESSEE
- TEXAS
- UTAH
- VERMONT
- VIRGINIA
- WASHINGTON
- WEST VIRGINIA
- WISCONSIN
- WYOMING
