Moving to Kingsland, Georgia
About Kingsland, Georgia

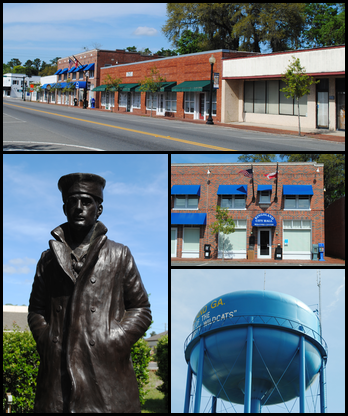
Kingsland is a city in Camden County, Georgia, United States. The population was 18,337 at the 2020 census, up from 15,946 at the 2010 census. It is the principal city of the Kingsland, Georgia Micropolitan Statistical Area. As Kingsland is 3 miles from the Florida-Georgia border and 32 miles from Jacksonville, it is also a principal city of the Jacksonville—Kingsland—Palatka, Florida—Georgia Combined Statistical Area.
The Kingsland Commercial Historic District was added to the National Register of Historic Places on March 17, 1994. It includes the area surrounding South Lee Street between King Street and William Street. It hosts an annual Catfish Festival on Labor Day weekend and is the location where the fan series Star Trek Continues was filmed.
Gender
| Gender | Kingsland | Georgia | Country |
|---|---|---|---|
| Female | 51.2% | 51.4% | 50.8% |
| Male | 48.8% | 48.6% | 49.2% |
Gender
Household Income
| Income | Kingsland | Georgia | Country |
|---|---|---|---|
| Less than $10,000 | 5.4% | 6.6% | 5.8% |
| $10,000 to $14,999 | 3.9% | 4.2% | 4.1% |
| $15,000 to $24,999 | 10.6% | 9% | 8.5% |
| $25,000 to $34,999 | 10.3% | 9.3% | 8.6% |
| $35,000 to $49,999 | 17% | 12.5% | 12.0% |
| $50,000 to $74,999 | 21.4% | 17.6% | 17.2% |
| $75,000 to $99,999 | 10.2% | 12.7% | 12.8% |
| $100,000 to $149,999 | 15.4% | 14.9% | 15.6% |
| $150,000 to $199,999 | 2.7% | 6.3% | 7.1% |
| $200,000 or more | 3% | 6.9% | 8.3% |
Education
| Education | Kingsland | Georgia | Country |
|---|---|---|---|
| < 9th Grade | 0% | 4% | 5.0% |
| 9-12th Grade | 5% | 8% | 7.0% |
| High School or GED | 37% | 28% | 27.0% |
| Other College | 27% | 20% | 20.0% |
| Associate's Degree | 11% | 8% | 9% |
| Bachelor's Degree | 13% | 20% | 20.0% |
| Master's Degree | 6% | 9% | 9.0% |
| Professional Degree | 1% | 2% | 2.0% |
| Doctorate Degree | 0% | 1% | 1.0% |
Household Income
Education
Race / Ethnicity
| Ethnicity | Kingsland | Georgia | Country |
|---|---|---|---|
| White | 61.9% | 52.1% | 60.1% |
| African American | 22.5% | 31.1% | 12.2% |
| American Indian | 0.3% | 0.2% | 0.6% |
| Asian | 1.5% | 4.1% | 5.6% |
| Hawaiian | 0% | 0.1% | 0.2% |
| Other | 0% | 0.4% | 0.3% |
| Multiracial | 4.8% | 2.5% | 2.8% |
| Hispanic | 9% | 9.6% | 18.2% |
Race / Ethnicity
- ALABAMA
- ALASKA
- ARIZONA
- ARKANSAS
- CALIFORNIA
- COLORADO
- CONNECTICUT
- DELAWARE
- FLORIDA
- GEORGIA
- HAWAII
- IDAHO
- ILLINOIS
- INDIANA
- IOWA
- KANSAS
- KENTUCKY
- LOUISIANA
- MAINE
- MARYLAND
- MASSACHUSETTS
- MICHIGAN
- MINNESOTA
- MISSISSIPPI
- MISSOURI
- MONTANA
- NEBRASKA
- NEVADA
- NEW HAMPSHIRE
- NEW JERSEY
- NEW MEXICO
- NEW YORK
- NORTH CAROLINA
- NORTH DAKOTA
- OHIO
- OKLAHOMA
- OREGON
- PENNSYLVANIA
- RHODE ISLAND
- SOUTH CAROLINA
- SOUTH DAKOTA
- TENNESSEE
- TEXAS
- UTAH
- VERMONT
- VIRGINIA
- WASHINGTON
- WEST VIRGINIA
- WISCONSIN
- WYOMING
