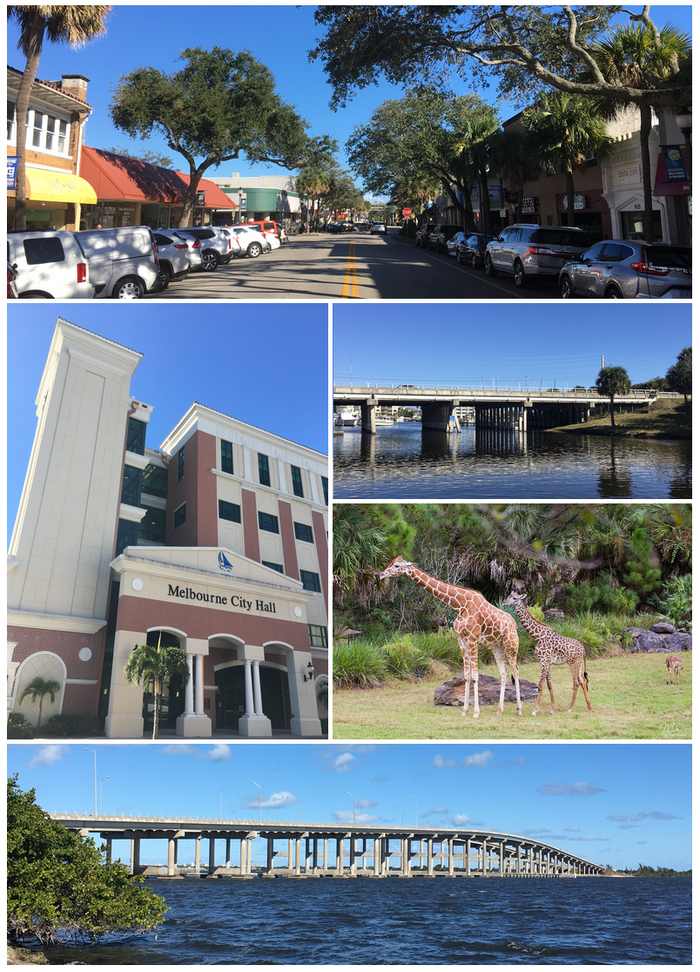
Moving to Melbourne, Florida
About Melbourne, Florida

Melbourne ( MEL-bərn) is a city in Brevard County, Florida, United States. It is located 72 miles (116 km) southeast of Orlando along Florida's Space Coast, named because of the region's proximity to Cape Canaveral and the Kennedy Space Center. The city had a population of 84,678 at the 2020 census. Melbourne is a principal city of the Palm Bay–Melbourne–Titusville Metropolitan Statistical Area. Downtown Melbourne and most of the city lies inland of the Indian River Lagoon, with a small part extending over to the barrier island.
Gender
| Gender | Melbourne | Florida | Country |
|---|---|---|---|
| Female | 51.1% | 51.1% | 50.8% |
| Male | 48.9% | 48.9% | 49.2% |
Gender
Household Income
| Income | Melbourne | Florida | Country |
|---|---|---|---|
| Less than $10,000 | 5.1% | 6.2% | 5.8% |
| $10,000 to $14,999 | 7.6% | 4.2% | 4.1% |
| $15,000 to $24,999 | 11.6% | 9.3% | 8.5% |
| $25,000 to $34,999 | 9.5% | 9.9% | 8.6% |
| $35,000 to $49,999 | 14.5% | 13.8% | 12.0% |
| $50,000 to $74,999 | 19.8% | 18.3% | 17.2% |
| $75,000 to $99,999 | 11.8% | 12.5% | 12.8% |
| $100,000 to $149,999 | 12.8% | 13.7% | 15.6% |
| $150,000 to $199,999 | 3.3% | 5.6% | 7.1% |
| $200,000 or more | 4% | 6.4% | 8.3% |
Education
| Education | Melbourne | Florida | Country |
|---|---|---|---|
| < 9th Grade | 3% | 5% | 5.0% |
| 9-12th Grade | 6% | 7% | 7.0% |
| High School or GED | 28% | 28% | 27.0% |
| Other College | 21% | 20% | 20.0% |
| Associate's Degree | 12% | 10% | 9% |
| Bachelor's Degree | 20% | 19% | 20.0% |
| Master's Degree | 8% | 8% | 9.0% |
| Professional Degree | 1% | 2% | 2.0% |
| Doctorate Degree | 1% | 1% | 1.0% |
Household Income
Education
Race / Ethnicity
| Ethnicity | Melbourne | Florida | Country |
|---|---|---|---|
| White | 70.8% | 53.4% | 60.1% |
| African American | 8.9% | 15.2% | 12.2% |
| American Indian | 0.2% | 0.2% | 0.6% |
| Asian | 4.1% | 2.7% | 5.6% |
| Hawaiian | 0.2% | 0.1% | 0.2% |
| Other | 0.7% | 0.4% | 0.3% |
| Multiracial | 3.4% | 2.2% | 2.8% |
| Hispanic | 11.7% | 25.8% | 18.2% |
Race / Ethnicity
- ALABAMA
- ALASKA
- ARIZONA
- ARKANSAS
- CALIFORNIA
- COLORADO
- CONNECTICUT
- DELAWARE
- FLORIDA
- GEORGIA
- HAWAII
- IDAHO
- ILLINOIS
- INDIANA
- IOWA
- KANSAS
- KENTUCKY
- LOUISIANA
- MAINE
- MARYLAND
- MASSACHUSETTS
- MICHIGAN
- MINNESOTA
- MISSISSIPPI
- MISSOURI
- MONTANA
- NEBRASKA
- NEVADA
- NEW HAMPSHIRE
- NEW JERSEY
- NEW MEXICO
- NEW YORK
- NORTH CAROLINA
- NORTH DAKOTA
- OHIO
- OKLAHOMA
- OREGON
- PENNSYLVANIA
- RHODE ISLAND
- SOUTH CAROLINA
- SOUTH DAKOTA
- TENNESSEE
- TEXAS
- UTAH
- VERMONT
- VIRGINIA
- WASHINGTON
- WEST VIRGINIA
- WISCONSIN
- WYOMING
