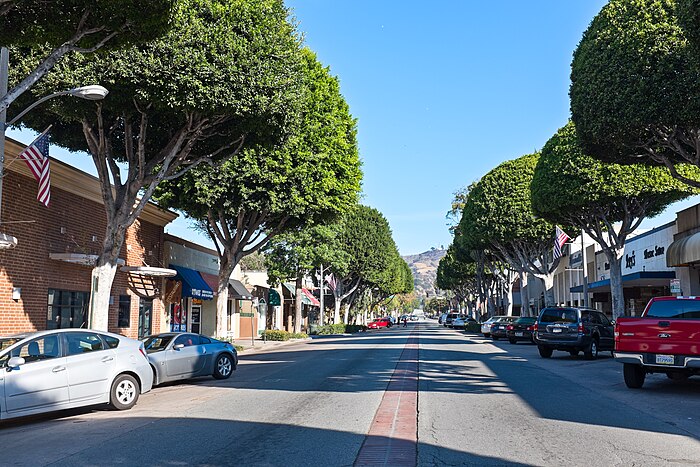
Moving to Whittier, California
About Whittier, California

Whittier () is a city in Southern California in Los Angeles County, part of the Gateway Cities. The 14.7-square-mile (38.0 km2) city had 87,306 residents as of the 2020 United States census, an increase of 1,975 from the 2010 census figure. Whittier was incorporated in February 1898 and became a charter city in 1955. The city is named for the Quaker poet John Greenleaf Whittier and is home to Whittier College. The city is surrounded by three unincorporated areas sharing the Whittier name, West Whittier-Los Nietos, South Whittier, and East Whittier, which combined are home to a larger population than Whittier proper.
Gender
| Gender | Whittier | California | Country |
|---|---|---|---|
| Female | 51.7% | 50.3% | 50.8% |
| Male | 48.3% | 49.7% | 49.2% |
Gender
Household Income
| Income | Whittier | California | Country |
|---|---|---|---|
| Less than $10,000 | 4.5% | 4.7% | 5.8% |
| $10,000 to $14,999 | 3.3% | 3.9% | 4.1% |
| $15,000 to $24,999 | 8.3% | 6.9% | 8.5% |
| $25,000 to $34,999 | 6.8% | 7.1% | 8.6% |
| $35,000 to $49,999 | 12.5% | 10% | 12.0% |
| $50,000 to $74,999 | 14.2% | 15.3% | 17.2% |
| $75,000 to $99,999 | 12.9% | 12.3% | 12.8% |
| $100,000 to $149,999 | 19% | 17.1% | 15.6% |
| $150,000 to $199,999 | 11.2% | 9.4% | 7.1% |
| $200,000 or more | 7.3% | 13.3% | 8.3% |
Education
| Education | Whittier | California | Country |
|---|---|---|---|
| < 9th Grade | 6% | 8% | 5.0% |
| 9-12th Grade | 6% | 7% | 7.0% |
| High School or GED | 29% | 20% | 27.0% |
| Other College | 24% | 21% | 20.0% |
| Associate's Degree | 9% | 8% | 9% |
| Bachelor's Degree | 16% | 22% | 20.0% |
| Master's Degree | 8% | 9% | 9.0% |
| Professional Degree | 1% | 3% | 2.0% |
| Doctorate Degree | 1% | 2% | 1.0% |
Household Income
Education
Race / Ethnicity
| Ethnicity | Whittier | California | Country |
|---|---|---|---|
| White | 24.5% | 36.5% | 60.1% |
| African American | 1.2% | 5.4% | 12.2% |
| American Indian | 0.4% | 0.3% | 0.6% |
| Asian | 5% | 14.6% | 5.6% |
| Hawaiian | 0% | 0.3% | 0.2% |
| Other | 1.6% | 0.3% | 0.3% |
| Multiracial | 1.5% | 3.4% | 2.8% |
| Hispanic | 65.8% | 39.1% | 18.2% |
Race / Ethnicity
- ALABAMA
- ALASKA
- ARIZONA
- ARKANSAS
- CALIFORNIA
- COLORADO
- CONNECTICUT
- DELAWARE
- FLORIDA
- GEORGIA
- HAWAII
- IDAHO
- ILLINOIS
- INDIANA
- IOWA
- KANSAS
- KENTUCKY
- LOUISIANA
- MAINE
- MARYLAND
- MASSACHUSETTS
- MICHIGAN
- MINNESOTA
- MISSISSIPPI
- MISSOURI
- MONTANA
- NEBRASKA
- NEVADA
- NEW HAMPSHIRE
- NEW JERSEY
- NEW MEXICO
- NEW YORK
- NORTH CAROLINA
- NORTH DAKOTA
- OHIO
- OKLAHOMA
- OREGON
- PENNSYLVANIA
- RHODE ISLAND
- SOUTH CAROLINA
- SOUTH DAKOTA
- TENNESSEE
- TEXAS
- UTAH
- VERMONT
- VIRGINIA
- WASHINGTON
- WEST VIRGINIA
- WISCONSIN
- WYOMING
