Moving to Livermore, California
About Livermore, California
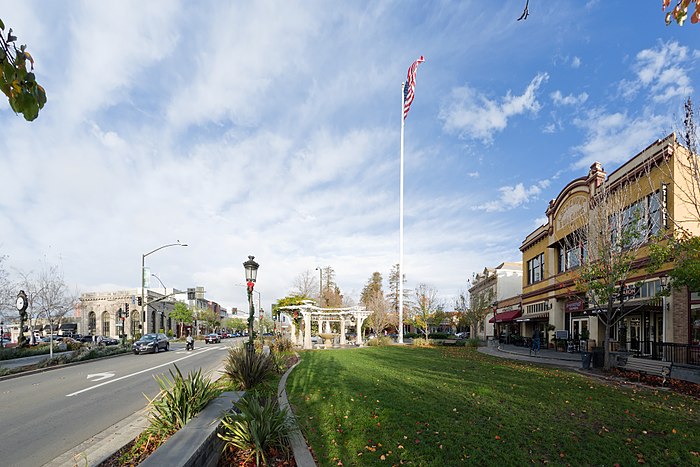
Livermore is a city in Alameda County, California. With a 2020 population of 87,955, Livermore is the most populous city in the Tri-Valley, giving its name to the Livermore Valley. It is located on the eastern edge of California's San Francisco Bay Area, making it the easternmost city in the area.
Livermore was a railroad town named for Robert Livermore, a local rancher who settled in the area in the 1840s. It is the home of the Lawrence Livermore National Laboratory, for which the chemical element livermorium is named (and thus, placing the city's name in the periodic table). It is also the California site of Sandia National Laboratories, which is headquartered in Albuquerque, New Mexico. Its south side is home to local vineyards, and its downtown district is being redeveloped as of 2024.
The United States Census Bureau defines an urban area of Tri-Valley-area cities, with Livermore as the principal city: the Livermore–Pleasanton–Dublin, CA urban area had a 2020 population of 240,381, making it the 167th largest in the United States.
Gender
| Gender | Livermore | California | Country |
|---|---|---|---|
| Female | 50.9% | 50.3% | 50.8% |
| Male | 49.1% | 49.7% | 49.2% |
Gender
Household Income
| Income | Livermore | California | Country |
|---|---|---|---|
| Less than $10,000 | 2.2% | 4.7% | 5.8% |
| $10,000 to $14,999 | 1.2% | 3.9% | 4.1% |
| $15,000 to $24,999 | 2.8% | 6.9% | 8.5% |
| $25,000 to $34,999 | 3.3% | 7.1% | 8.6% |
| $35,000 to $49,999 | 5.4% | 10% | 12.0% |
| $50,000 to $74,999 | 12.3% | 15.3% | 17.2% |
| $75,000 to $99,999 | 9.7% | 12.3% | 12.8% |
| $100,000 to $149,999 | 19.6% | 17.1% | 15.6% |
| $150,000 to $199,999 | 16.1% | 9.4% | 7.1% |
| $200,000 or more | 27.4% | 13.3% | 8.3% |
Education
| Education | Livermore | California | Country |
|---|---|---|---|
| < 9th Grade | 4% | 8% | 5.0% |
| 9-12th Grade | 3% | 7% | 7.0% |
| High School or GED | 16% | 20% | 27.0% |
| Other College | 23% | 21% | 20.0% |
| Associate's Degree | 10% | 8% | 9% |
| Bachelor's Degree | 29% | 22% | 20.0% |
| Master's Degree | 10% | 9% | 9.0% |
| Professional Degree | 2% | 3% | 2.0% |
| Doctorate Degree | 3% | 2% | 1.0% |
Household Income
Education
Race / Ethnicity
| Ethnicity | Livermore | California | Country |
|---|---|---|---|
| White | 59.1% | 36.5% | 60.1% |
| African American | 1.7% | 5.4% | 12.2% |
| American Indian | 0.1% | 0.3% | 0.6% |
| Asian | 12.9% | 14.6% | 5.6% |
| Hawaiian | 0.5% | 0.3% | 0.2% |
| Other | 0.1% | 0.3% | 0.3% |
| Multiracial | 4.3% | 3.4% | 2.8% |
| Hispanic | 21.3% | 39.1% | 18.2% |
Race / Ethnicity
- ALABAMA
- ALASKA
- ARIZONA
- ARKANSAS
- CALIFORNIA
- COLORADO
- CONNECTICUT
- DELAWARE
- FLORIDA
- GEORGIA
- HAWAII
- IDAHO
- ILLINOIS
- INDIANA
- IOWA
- KANSAS
- KENTUCKY
- LOUISIANA
- MAINE
- MARYLAND
- MASSACHUSETTS
- MICHIGAN
- MINNESOTA
- MISSISSIPPI
- MISSOURI
- MONTANA
- NEBRASKA
- NEVADA
- NEW HAMPSHIRE
- NEW JERSEY
- NEW MEXICO
- NEW YORK
- NORTH CAROLINA
- NORTH DAKOTA
- OHIO
- OKLAHOMA
- OREGON
- PENNSYLVANIA
- RHODE ISLAND
- SOUTH CAROLINA
- SOUTH DAKOTA
- TENNESSEE
- TEXAS
- UTAH
- VERMONT
- VIRGINIA
- WASHINGTON
- WEST VIRGINIA
- WISCONSIN
- WYOMING