Moving to Indio, California
About Indio, California

Indio (Spanish for "Indian") is a city in Riverside County, California, United States, in the Coachella Valley of Southern California's Colorado Desert region. Indio is approximately 125 miles (201 km) east of Los Angeles, 23 miles (37 km) east of Palm Springs, and 98 miles (158 km) west of Blythe, California.
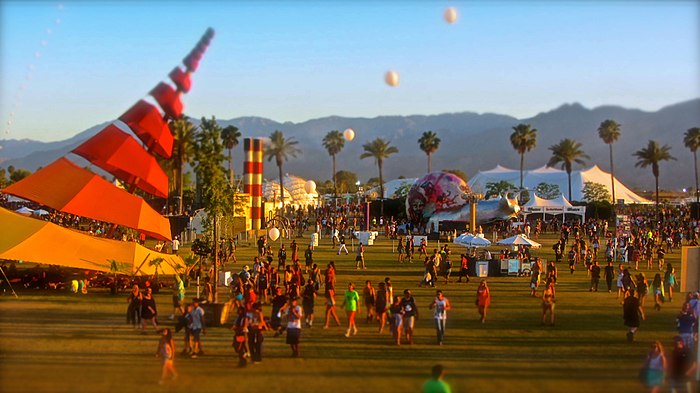
The population was 89,137 in the 2020 United States Census, up from 76,036 at the 2010 census, an increase of 17%. Indio is the most populous city in the Coachella Valley, and was formerly referred to as the "Hub of the Valley," a Chamber of Commerce slogan used in the mid-twentieth century. Indio is now nicknamed the "City of Festivals," a reference to the numerous cultural events held in the city, most notably the Coachella Valley Music and Arts Festival.
Indio is the principal city of an urban area defined by the United States Census Bureau that is located in the Coachella Valley: the Indio–Palm Desert–Palm Springs CA urban area had a population of 361,075 as of the 2020 census, making it the 114th-most populous urban area in the United States.
Gender
| Gender | Indio | California | Country |
|---|---|---|---|
| Female | 51.2% | 50.3% | 50.8% |
| Male | 48.8% | 49.7% | 49.2% |
Gender
Household Income
| Income | Indio | California | Country |
|---|---|---|---|
| Less than $10,000 | 7.6% | 4.7% | 5.8% |
| $10,000 to $14,999 | 4.9% | 3.9% | 4.1% |
| $15,000 to $24,999 | 11.9% | 6.9% | 8.5% |
| $25,000 to $34,999 | 9.8% | 7.1% | 8.6% |
| $35,000 to $49,999 | 12.8% | 10% | 12.0% |
| $50,000 to $74,999 | 18.9% | 15.3% | 17.2% |
| $75,000 to $99,999 | 11.4% | 12.3% | 12.8% |
| $100,000 to $149,999 | 12.3% | 17.1% | 15.6% |
| $150,000 to $199,999 | 6.5% | 9.4% | 7.1% |
| $200,000 or more | 3.9% | 13.3% | 8.3% |
Education
| Education | Indio | California | Country |
|---|---|---|---|
| < 9th Grade | 10% | 8% | 5.0% |
| 9-12th Grade | 10% | 7% | 7.0% |
| High School or GED | 35% | 20% | 27.0% |
| Other College | 21% | 21% | 20.0% |
| Associate's Degree | 6% | 8% | 9% |
| Bachelor's Degree | 11% | 22% | 20.0% |
| Master's Degree | 5% | 9% | 9.0% |
| Professional Degree | 1% | 3% | 2.0% |
| Doctorate Degree | 1% | 2% | 1.0% |
Household Income
Education
Race / Ethnicity
| Ethnicity | Indio | California | Country |
|---|---|---|---|
| White | 27.9% | 36.5% | 60.1% |
| African American | 3.5% | 5.4% | 12.2% |
| American Indian | 0.1% | 0.3% | 0.6% |
| Asian | 2.2% | 14.6% | 5.6% |
| Hawaiian | 0% | 0.3% | 0.2% |
| Other | 0.2% | 0.3% | 0.3% |
| Multiracial | 1.3% | 3.4% | 2.8% |
| Hispanic | 64.9% | 39.1% | 18.2% |
Race / Ethnicity
- ALABAMA
- ALASKA
- ARIZONA
- ARKANSAS
- CALIFORNIA
- COLORADO
- CONNECTICUT
- DELAWARE
- FLORIDA
- GEORGIA
- HAWAII
- IDAHO
- ILLINOIS
- INDIANA
- IOWA
- KANSAS
- KENTUCKY
- LOUISIANA
- MAINE
- MARYLAND
- MASSACHUSETTS
- MICHIGAN
- MINNESOTA
- MISSISSIPPI
- MISSOURI
- MONTANA
- NEBRASKA
- NEVADA
- NEW HAMPSHIRE
- NEW JERSEY
- NEW MEXICO
- NEW YORK
- NORTH CAROLINA
- NORTH DAKOTA
- OHIO
- OKLAHOMA
- OREGON
- PENNSYLVANIA
- RHODE ISLAND
- SOUTH CAROLINA
- SOUTH DAKOTA
- TENNESSEE
- TEXAS
- UTAH
- VERMONT
- VIRGINIA
- WASHINGTON
- WEST VIRGINIA
- WISCONSIN
- WYOMING
