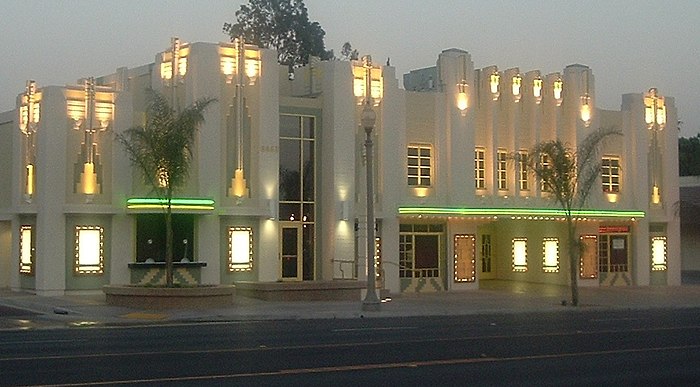
Moving to Fontana, California
About Fontana, California

Fontana is a city in San Bernardino County, California, United States. Founded by Azariel Blanchard Miller in 1913, it remained essentially rural until World War II, when entrepreneur Henry J. Kaiser built a large steel mill in the area. It is now a regional hub of the trucking industry, with the east–west Interstate 10 and State Route 210 crossing the city and Interstate 15 passing diagonally through its northwestern quadrant. The city is about 46 miles (74 km) east of Los Angeles.
The United States Census Bureau reported that Fontana's 2020 population was 208,393, making it the second-most-populous city in San Bernardino County and the 20th largest in the state.
Gender
| Gender | Fontana | California | Country |
|---|---|---|---|
| Female | 50.1% | 50.3% | 50.8% |
| Male | 49.9% | 49.7% | 49.2% |
Gender
Household Income
| Income | Fontana | California | Country |
|---|---|---|---|
| Less than $10,000 | 2.7% | 4.7% | 5.8% |
| $10,000 to $14,999 | 2.8% | 3.9% | 4.1% |
| $15,000 to $24,999 | 7% | 6.9% | 8.5% |
| $25,000 to $34,999 | 6.4% | 7.1% | 8.6% |
| $35,000 to $49,999 | 10.1% | 10% | 12.0% |
| $50,000 to $74,999 | 20.6% | 15.3% | 17.2% |
| $75,000 to $99,999 | 14.7% | 12.3% | 12.8% |
| $100,000 to $149,999 | 20% | 17.1% | 15.6% |
| $150,000 to $199,999 | 8.5% | 9.4% | 7.1% |
| $200,000 or more | 7.2% | 13.3% | 8.3% |
Education
| Education | Fontana | California | Country |
|---|---|---|---|
| < 9th Grade | 12% | 8% | 5.0% |
| 9-12th Grade | 11% | 7% | 7.0% |
| High School or GED | 28% | 20% | 27.0% |
| Other College | 23% | 21% | 20.0% |
| Associate's Degree | 7% | 8% | 9% |
| Bachelor's Degree | 14% | 22% | 20.0% |
| Master's Degree | 4% | 9% | 9.0% |
| Professional Degree | 1% | 3% | 2.0% |
| Doctorate Degree | 0% | 2% | 1.0% |
Household Income
Education
Race / Ethnicity
| Ethnicity | Fontana | California | Country |
|---|---|---|---|
| White | 14% | 36.5% | 60.1% |
| African American | 8% | 5.4% | 12.2% |
| American Indian | 0.2% | 0.3% | 0.6% |
| Asian | 6.5% | 14.6% | 5.6% |
| Hawaiian | 0.2% | 0.3% | 0.2% |
| Other | 0.2% | 0.3% | 0.3% |
| Multiracial | 2.3% | 3.4% | 2.8% |
| Hispanic | 68.5% | 39.1% | 18.2% |
Race / Ethnicity
- ALABAMA
- ALASKA
- ARIZONA
- ARKANSAS
- CALIFORNIA
- COLORADO
- CONNECTICUT
- DELAWARE
- FLORIDA
- GEORGIA
- HAWAII
- IDAHO
- ILLINOIS
- INDIANA
- IOWA
- KANSAS
- KENTUCKY
- LOUISIANA
- MAINE
- MARYLAND
- MASSACHUSETTS
- MICHIGAN
- MINNESOTA
- MISSISSIPPI
- MISSOURI
- MONTANA
- NEBRASKA
- NEVADA
- NEW HAMPSHIRE
- NEW JERSEY
- NEW MEXICO
- NEW YORK
- NORTH CAROLINA
- NORTH DAKOTA
- OHIO
- OKLAHOMA
- OREGON
- PENNSYLVANIA
- RHODE ISLAND
- SOUTH CAROLINA
- SOUTH DAKOTA
- TENNESSEE
- TEXAS
- UTAH
- VERMONT
- VIRGINIA
- WASHINGTON
- WEST VIRGINIA
- WISCONSIN
- WYOMING
