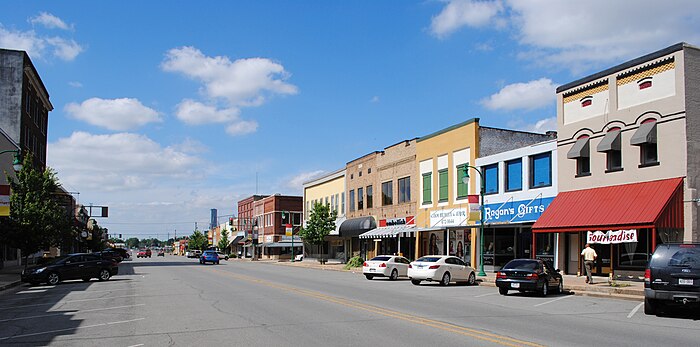
Moving to Stuttgart, Arkansas
About Stuttgart, Arkansas

Stuttgart is a city in and the county seat of the northern district of Arkansas County, Arkansas, United States. As of the 2010 census it had a population of 9,326.
Known as the "Rice and Duck Capital of the World", Stuttgart is an international destination for waterfowl hunting along the Mississippi Flyway. Founded in 1880, it was named for Stuttgart, Germany. Stuttgart situated on the Arkansas Grand Prairie, a region known for rice cultivation. The economy is largely based on agricultural production, waterfowl tourism, and supporting industries.
It is located on U.S. Route 165, approximately 45 miles (72 km) southeast of Little Rock; and on U.S. Route 79 approximately 110 miles southwest of Memphis, Tennessee. Stuttgart is also on the Union Pacific Railroad between Memphis, Tennessee, and Pine Bluff, Arkansas.
Gender
| Gender | Stuttgart | Arkansas | Country |
|---|---|---|---|
| Female | 51.6% | 50.9% | 50.8% |
| Male | 48.4% | 49.1% | 49.2% |
Gender
Household Income
| Income | Stuttgart | Arkansas | Country |
|---|---|---|---|
| Less than $10,000 | 11.2% | 7.4% | 5.8% |
| $10,000 to $14,999 | 10.7% | 5.6% | 4.1% |
| $15,000 to $24,999 | 7% | 11.9% | 8.5% |
| $25,000 to $34,999 | 9.1% | 11.3% | 8.6% |
| $35,000 to $49,999 | 12.1% | 14.1% | 12.0% |
| $50,000 to $74,999 | 19.5% | 18.4% | 17.2% |
| $75,000 to $99,999 | 11.1% | 11.6% | 12.8% |
| $100,000 to $149,999 | 10.4% | 11.7% | 15.6% |
| $150,000 to $199,999 | 5.6% | 4% | 7.1% |
| $200,000 or more | 3.2% | 4% | 8.3% |
Education
| Education | Stuttgart | Arkansas | Country |
|---|---|---|---|
| < 9th Grade | 8% | 6% | 5.0% |
| 9-12th Grade | 8% | 8% | 7.0% |
| High School or GED | 45% | 34% | 27.0% |
| Other College | 15% | 22% | 20.0% |
| Associate's Degree | 9% | 7% | 9% |
| Bachelor's Degree | 10% | 15% | 20.0% |
| Master's Degree | 4% | 6% | 9.0% |
| Professional Degree | 0% | 1% | 2.0% |
| Doctorate Degree | 1% | 1% | 1.0% |
Household Income
Education
Race / Ethnicity
| Ethnicity | Stuttgart | Arkansas | Country |
|---|---|---|---|
| White | 60.2% | 71.6% | 60.1% |
| African American | 35.3% | 15.1% | 12.2% |
| American Indian | 0.6% | 0.5% | 0.6% |
| Asian | 0.1% | 1.5% | 5.6% |
| Hawaiian | 0% | 0.3% | 0.2% |
| Other | 0% | 0.2% | 0.3% |
| Multiracial | 2.2% | 3.1% | 2.8% |
| Hispanic | 1.6% | 7.6% | 18.2% |
Race / Ethnicity
- ALABAMA
- ALASKA
- ARIZONA
- ARKANSAS
- CALIFORNIA
- COLORADO
- CONNECTICUT
- DELAWARE
- FLORIDA
- GEORGIA
- HAWAII
- IDAHO
- ILLINOIS
- INDIANA
- IOWA
- KANSAS
- KENTUCKY
- LOUISIANA
- MAINE
- MARYLAND
- MASSACHUSETTS
- MICHIGAN
- MINNESOTA
- MISSISSIPPI
- MISSOURI
- MONTANA
- NEBRASKA
- NEVADA
- NEW HAMPSHIRE
- NEW JERSEY
- NEW MEXICO
- NEW YORK
- NORTH CAROLINA
- NORTH DAKOTA
- OHIO
- OKLAHOMA
- OREGON
- PENNSYLVANIA
- RHODE ISLAND
- SOUTH CAROLINA
- SOUTH DAKOTA
- TENNESSEE
- TEXAS
- UTAH
- VERMONT
- VIRGINIA
- WASHINGTON
- WEST VIRGINIA
- WISCONSIN
- WYOMING
