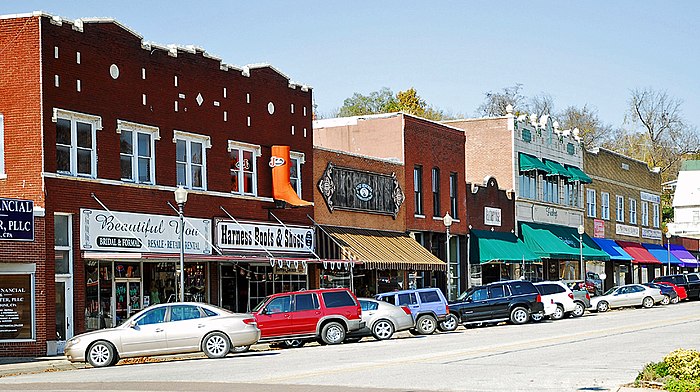
Moving to Harrison, Arkansas
About Harrison, Arkansas

The city of Harrison is the county seat of Boone County, Arkansas, United States. It is named after Marcus LaRue Harrison, a surveyor who laid out the city along Crooked Creek at Stifler Springs. According to 2019 Census Bureau estimates, the population of the city was 13,069, up from 12,943 at the 2010 census and it is the 30th largest city in Arkansas based on official 2019 estimates from the U.S. Census Bureau. Harrison is the principal city of the Harrison Micropolitan Statistical Area, which includes all of Boone and Newton counties.
The community has a history of racism: there were two race riots in the early 20th century and an influx of white supremacist organizations during the late 20th and early 21st centuries.
Gender
| Gender | Harrison | Arkansas | Country |
|---|---|---|---|
| Female | 51% | 50.9% | 50.8% |
| Male | 49% | 49.1% | 49.2% |
Gender
Household Income
| Income | Harrison | Arkansas | Country |
|---|---|---|---|
| Less than $10,000 | 8.5% | 7.4% | 5.8% |
| $10,000 to $14,999 | 7.5% | 5.6% | 4.1% |
| $15,000 to $24,999 | 11.8% | 11.9% | 8.5% |
| $25,000 to $34,999 | 14.5% | 11.3% | 8.6% |
| $35,000 to $49,999 | 16.1% | 14.1% | 12.0% |
| $50,000 to $74,999 | 16.4% | 18.4% | 17.2% |
| $75,000 to $99,999 | 13.2% | 11.6% | 12.8% |
| $100,000 to $149,999 | 7.9% | 11.7% | 15.6% |
| $150,000 to $199,999 | 1.5% | 4% | 7.1% |
| $200,000 or more | 2.6% | 4% | 8.3% |
Education
| Education | Harrison | Arkansas | Country |
|---|---|---|---|
| < 9th Grade | 4% | 6% | 5.0% |
| 9-12th Grade | 9% | 8% | 7.0% |
| High School or GED | 33% | 34% | 27.0% |
| Other College | 24% | 22% | 20.0% |
| Associate's Degree | 9% | 7% | 9% |
| Bachelor's Degree | 12% | 15% | 20.0% |
| Master's Degree | 7% | 6% | 9.0% |
| Professional Degree | 1% | 1% | 2.0% |
| Doctorate Degree | 1% | 1% | 1.0% |
Household Income
Education
Race / Ethnicity
| Ethnicity | Harrison | Arkansas | Country |
|---|---|---|---|
| White | 91.7% | 71.6% | 60.1% |
| African American | 0.1% | 15.1% | 12.2% |
| American Indian | 0.7% | 0.5% | 0.6% |
| Asian | 1.1% | 1.5% | 5.6% |
| Hawaiian | 0% | 0.3% | 0.2% |
| Other | 0% | 0.2% | 0.3% |
| Multiracial | 3.8% | 3.1% | 2.8% |
| Hispanic | 2.6% | 7.6% | 18.2% |
Race / Ethnicity
- ALABAMA
- ALASKA
- ARIZONA
- ARKANSAS
- CALIFORNIA
- COLORADO
- CONNECTICUT
- DELAWARE
- FLORIDA
- GEORGIA
- HAWAII
- IDAHO
- ILLINOIS
- INDIANA
- IOWA
- KANSAS
- KENTUCKY
- LOUISIANA
- MAINE
- MARYLAND
- MASSACHUSETTS
- MICHIGAN
- MINNESOTA
- MISSISSIPPI
- MISSOURI
- MONTANA
- NEBRASKA
- NEVADA
- NEW HAMPSHIRE
- NEW JERSEY
- NEW MEXICO
- NEW YORK
- NORTH CAROLINA
- NORTH DAKOTA
- OHIO
- OKLAHOMA
- OREGON
- PENNSYLVANIA
- RHODE ISLAND
- SOUTH CAROLINA
- SOUTH DAKOTA
- TENNESSEE
- TEXAS
- UTAH
- VERMONT
- VIRGINIA
- WASHINGTON
- WEST VIRGINIA
- WISCONSIN
- WYOMING
