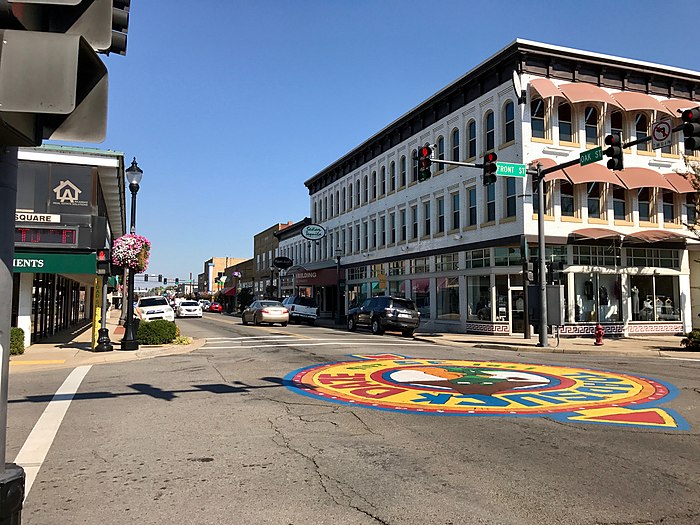
Moving to Conway, Arkansas
About Conway, Arkansas

Conway is a city in the U.S. state of Arkansas and the county seat of Faulkner County, located in the state's most populous Metropolitan Statistical Area, Central Arkansas. The city also serves as a regional shopping, educational, work, healthcare, sports, and cultural hub for Faulkner County and surrounding areas. Conway's growth can be attributed to its jobs in technology and higher education. Conway is home to three post-secondary educational institutions, earning it the nickname "The City of Colleges".
As of the 2020 Census, the city proper had a total population of 64,134, making Conway the eighth-most populous city in Arkansas. Central Arkansas, the Little Rock–North Little Rock–Conway, AR Metropolitan Statistical Area, is ranked the 76th most populous in the United States with 734,622 people in 2016. Conway is part of the larger Little Rock–North Little Rock, AR Combined Statistical Area, which in 2016 had a population of 905,847, and ranked the country's 60th largest CSA.
Gender
| Gender | Conway | Arkansas | Country |
|---|---|---|---|
| Female | 53.1% | 50.9% | 50.8% |
| Male | 46.9% | 49.1% | 49.2% |
Gender
Household Income
| Income | Conway | Arkansas | Country |
|---|---|---|---|
| Less than $10,000 | 9.8% | 7.4% | 5.8% |
| $10,000 to $14,999 | 4.4% | 5.6% | 4.1% |
| $15,000 to $24,999 | 10.5% | 11.9% | 8.5% |
| $25,000 to $34,999 | 12.3% | 11.3% | 8.6% |
| $35,000 to $49,999 | 14.5% | 14.1% | 12.0% |
| $50,000 to $74,999 | 15.1% | 18.4% | 17.2% |
| $75,000 to $99,999 | 11.9% | 11.6% | 12.8% |
| $100,000 to $149,999 | 12.4% | 11.7% | 15.6% |
| $150,000 to $199,999 | 4.9% | 4% | 7.1% |
| $200,000 or more | 4.2% | 4% | 8.3% |
Education
| Education | Conway | Arkansas | Country |
|---|---|---|---|
| < 9th Grade | 2% | 6% | 5.0% |
| 9-12th Grade | 4% | 8% | 7.0% |
| High School or GED | 26% | 34% | 27.0% |
| Other College | 20% | 22% | 20.0% |
| Associate's Degree | 7% | 7% | 9% |
| Bachelor's Degree | 24% | 15% | 20.0% |
| Master's Degree | 13% | 6% | 9.0% |
| Professional Degree | 2% | 1% | 2.0% |
| Doctorate Degree | 2% | 1% | 1.0% |
Household Income
Education
Race / Ethnicity
| Ethnicity | Conway | Arkansas | Country |
|---|---|---|---|
| White | 71.9% | 71.6% | 60.1% |
| African American | 17.8% | 15.1% | 12.2% |
| American Indian | 0.2% | 0.5% | 0.6% |
| Asian | 1.9% | 1.5% | 5.6% |
| Hawaiian | 0% | 0.3% | 0.2% |
| Other | 0.7% | 0.2% | 0.3% |
| Multiracial | 3% | 3.1% | 2.8% |
| Hispanic | 4.4% | 7.6% | 18.2% |
Race / Ethnicity
- ALABAMA
- ALASKA
- ARIZONA
- ARKANSAS
- CALIFORNIA
- COLORADO
- CONNECTICUT
- DELAWARE
- FLORIDA
- GEORGIA
- HAWAII
- IDAHO
- ILLINOIS
- INDIANA
- IOWA
- KANSAS
- KENTUCKY
- LOUISIANA
- MAINE
- MARYLAND
- MASSACHUSETTS
- MICHIGAN
- MINNESOTA
- MISSISSIPPI
- MISSOURI
- MONTANA
- NEBRASKA
- NEVADA
- NEW HAMPSHIRE
- NEW JERSEY
- NEW MEXICO
- NEW YORK
- NORTH CAROLINA
- NORTH DAKOTA
- OHIO
- OKLAHOMA
- OREGON
- PENNSYLVANIA
- RHODE ISLAND
- SOUTH CAROLINA
- SOUTH DAKOTA
- TENNESSEE
- TEXAS
- UTAH
- VERMONT
- VIRGINIA
- WASHINGTON
- WEST VIRGINIA
- WISCONSIN
- WYOMING
