Moving to Cordova, Alaska
About Cordova, Alaska

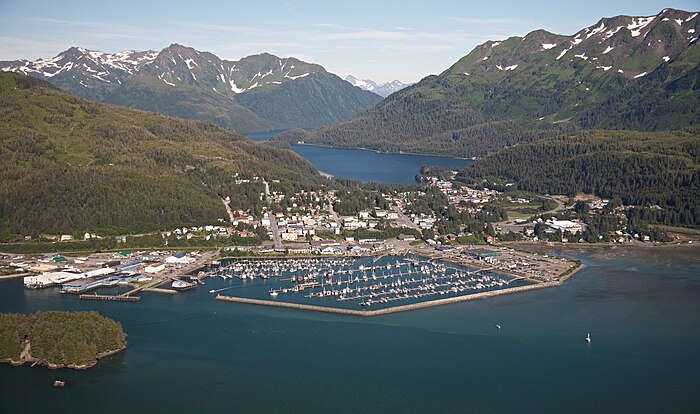
Cordova ( kor-DOH-və, KOR-də-və) is a city in Chugach Census Area, Alaska, United States. It lies near the mouth of the Copper River, at the head of Orca Inlet on the east side of Prince William Sound. The population was 2,609 at the 2020 census, up from 2,239 in 2010.
Cordova was named Puerto Córdoba by Spanish explorer Salvador Fidalgo in 1790. No roads connect Cordova to other Alaskan communities, so a plane or ferry is required to travel there. In the Exxon Valdez oil spill of March 1989, an oil tanker ran aground northwest of Cordova, heavily damaging ecology and fishing. It was cleaned up shortly after, but there are lingering effects, such as a lowered population of some birds.
Gender
| Gender | Cordova | Alaska | Country |
|---|---|---|---|
| Female | 44.8% | 47.8% | 50.8% |
| Male | 55.2% | 52.2% | 49.2% |
Gender
Household Income
| Income | Cordova | Alaska | Country |
|---|---|---|---|
| Less than $10,000 | 0% | 3.8% | 5.8% |
| $10,000 to $14,999 | 4% | 2.9% | 4.1% |
| $15,000 to $24,999 | 0.7% | 6.2% | 8.5% |
| $25,000 to $34,999 | 4% | 6.7% | 8.6% |
| $35,000 to $49,999 | 6% | 10.1% | 12.0% |
| $50,000 to $74,999 | 25.2% | 18.3% | 17.2% |
| $75,000 to $99,999 | 12.5% | 14.2% | 12.8% |
| $100,000 to $149,999 | 23.7% | 19.3% | 15.6% |
| $150,000 to $199,999 | 9.2% | 9.6% | 7.1% |
| $200,000 or more | 14.6% | 8.8% | 8.3% |
Education
| Education | Cordova | Alaska | Country |
|---|---|---|---|
| < 9th Grade | -1% | 3% | 5.0% |
| 9-12th Grade | 5% | 4% | 7.0% |
| High School or GED | 34% | 28% | 27.0% |
| Other College | 26% | 26% | 20.0% |
| Associate's Degree | 6% | 9% | 9% |
| Bachelor's Degree | 25% | 19% | 20.0% |
| Master's Degree | 4% | 8% | 9.0% |
| Professional Degree | 1% | 2% | 2.0% |
| Doctorate Degree | 0% | 1% | 1.0% |
Household Income
Education
Race / Ethnicity
| Ethnicity | Cordova | Alaska | Country |
|---|---|---|---|
| White | 62.5% | 59.7% | 60.1% |
| African American | 0.5% | 3.1% | 12.2% |
| American Indian | 10.6% | 14.1% | 0.6% |
| Asian | 10.5% | 6.2% | 5.6% |
| Hawaiian | 1.2% | 1.4% | 0.2% |
| Other | 0% | 0.4% | 0.3% |
| Multiracial | 10.2% | 7.9% | 2.8% |
| Hispanic | 4.5% | 7.2% | 18.2% |
Race / Ethnicity
- ALABAMA
- ALASKA
- ARIZONA
- ARKANSAS
- CALIFORNIA
- COLORADO
- CONNECTICUT
- DELAWARE
- FLORIDA
- GEORGIA
- HAWAII
- IDAHO
- ILLINOIS
- INDIANA
- IOWA
- KANSAS
- KENTUCKY
- LOUISIANA
- MAINE
- MARYLAND
- MASSACHUSETTS
- MICHIGAN
- MINNESOTA
- MISSISSIPPI
- MISSOURI
- MONTANA
- NEBRASKA
- NEVADA
- NEW HAMPSHIRE
- NEW JERSEY
- NEW MEXICO
- NEW YORK
- NORTH CAROLINA
- NORTH DAKOTA
- OHIO
- OKLAHOMA
- OREGON
- PENNSYLVANIA
- RHODE ISLAND
- SOUTH CAROLINA
- SOUTH DAKOTA
- TENNESSEE
- TEXAS
- UTAH
- VERMONT
- VIRGINIA
- WASHINGTON
- WEST VIRGINIA
- WISCONSIN
- WYOMING
