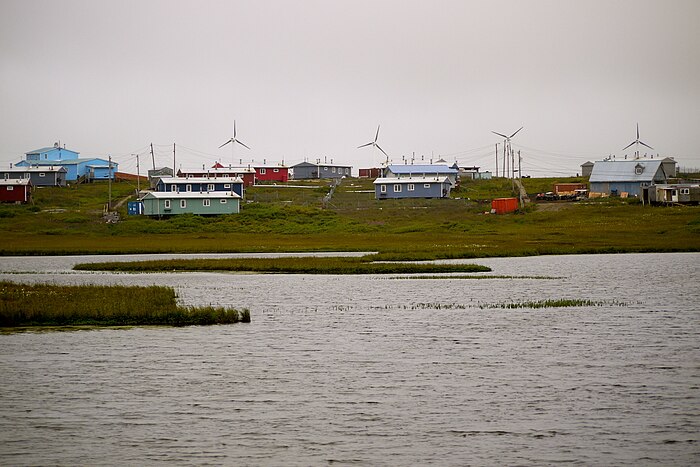
Moving to Chevak, Alaska
About Chevak, Alaska

Chevak (Cevʼaq , which means "cut-through channel" in Chevak Cup’ik) is a city in Kusilvak Census Area, Alaska, United States. At the 2020 census the population was 951, up from 938 in 2010.
There is a tri-language system in Chevak; English, Cup’ik, and a mixture of the two languages. The people in Chevak speak a dialect of Central Yup'ik, Cup'ik (pr. Chew-pick), and identify themselves as Cup'ik people rather than Yup'ik. This unique identity has allowed them to form a single-site school district, the Kashunamiut School District, rather than joining a neighboring Yup'ik school district. The Cup'ik dialect is distinguished from Yup'ik by the change of "y" sounds into "ch" sounds, represented by the letter "c", and by some words that are completely different from Yup'ik words.
Gender
| Gender | Chevak | Alaska | Country |
|---|---|---|---|
| Female | 41.4% | 47.8% | 50.8% |
| Male | 58.6% | 52.2% | 49.2% |
Gender
Household Income
| Income | Chevak | Alaska | Country |
|---|---|---|---|
| Less than $10,000 | 14.9% | 3.8% | 5.8% |
| $10,000 to $14,999 | 4.4% | 2.9% | 4.1% |
| $15,000 to $24,999 | 10.5% | 6.2% | 8.5% |
| $25,000 to $34,999 | 10.5% | 6.7% | 8.6% |
| $35,000 to $49,999 | 27.1% | 10.1% | 12.0% |
| $50,000 to $74,999 | 14.4% | 18.3% | 17.2% |
| $75,000 to $99,999 | 9.9% | 14.2% | 12.8% |
| $100,000 to $149,999 | 7.2% | 19.3% | 15.6% |
| $150,000 to $199,999 | 1.1% | 9.6% | 7.1% |
| $200,000 or more | -1.4210854715202E-14% | 8.8% | 8.3% |
Education
| Education | Chevak | Alaska | Country |
|---|---|---|---|
| < 9th Grade | 4% | 3% | 5.0% |
| 9-12th Grade | 14% | 4% | 7.0% |
| High School or GED | 64% | 28% | 27.0% |
| Other College | 13% | 26% | 20.0% |
| Associate's Degree | 1% | 9% | 9% |
| Bachelor's Degree | 2% | 19% | 20.0% |
| Master's Degree | 2% | 8% | 9.0% |
| Professional Degree | 0% | 2% | 2.0% |
| Doctorate Degree | 0% | 1% | 1.0% |
Household Income
Education
Race / Ethnicity
| Ethnicity | Chevak | Alaska | Country |
|---|---|---|---|
| White | 11.4% | 59.7% | 60.1% |
| African American | 0% | 3.1% | 12.2% |
| American Indian | 87% | 14.1% | 0.6% |
| Asian | 0% | 6.2% | 5.6% |
| Hawaiian | 0% | 1.4% | 0.2% |
| Other | 0.3% | 0.4% | 0.3% |
| Multiracial | 0.6% | 7.9% | 2.8% |
| Hispanic | 0.8% | 7.2% | 18.2% |
Race / Ethnicity
- ALABAMA
- ALASKA
- ARIZONA
- ARKANSAS
- CALIFORNIA
- COLORADO
- CONNECTICUT
- DELAWARE
- FLORIDA
- GEORGIA
- HAWAII
- IDAHO
- ILLINOIS
- INDIANA
- IOWA
- KANSAS
- KENTUCKY
- LOUISIANA
- MAINE
- MARYLAND
- MASSACHUSETTS
- MICHIGAN
- MINNESOTA
- MISSISSIPPI
- MISSOURI
- MONTANA
- NEBRASKA
- NEVADA
- NEW HAMPSHIRE
- NEW JERSEY
- NEW MEXICO
- NEW YORK
- NORTH CAROLINA
- NORTH DAKOTA
- OHIO
- OKLAHOMA
- OREGON
- PENNSYLVANIA
- RHODE ISLAND
- SOUTH CAROLINA
- SOUTH DAKOTA
- TENNESSEE
- TEXAS
- UTAH
- VERMONT
- VIRGINIA
- WASHINGTON
- WEST VIRGINIA
- WISCONSIN
- WYOMING
