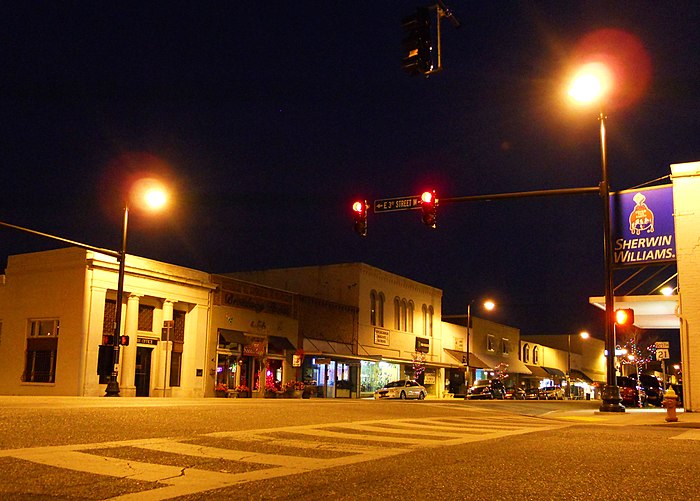
Moving to Sylacauga, Alabama
About Sylacauga, Alabama

Sylacauga is a city in Talladega County, Alabama, United States. At the 2020 census, the population was 12,578.
Sylacauga is known for its fine white marble bedrock. This was discovered shortly after settlers moved into the area and has been quarried ever since. The marble industry was the first recorded industry in the Sylacauga area.
Sylacauga is the site of the first documented case of an object from outer space hitting a person. On November 30, 1954, a 4 kg (9 lb) piece of what became known as the Hodges Fragment from the Sylacauga Meteorite crashed through the roof of an Oak Grove house, bounced off a radio, and badly bruised Ann Hodges, who was taking an afternoon nap.
Sylacauga is on the 2010 list of "100 Best Communities for Young People" by America's Promise Alliance.
Gender
| Gender | Sylacauga | Alabama | Country |
|---|---|---|---|
| Female | 54.3% | 51.7% | 50.8% |
| Male | 45.7% | 48.3% | 49.2% |
Gender
Household Income
| Income | Sylacauga | Alabama | Country |
|---|---|---|---|
| Less than $10,000 | 13.7% | 8.1% | 5.8% |
| $10,000 to $14,999 | 8.8% | 5.6% | 4.1% |
| $15,000 to $24,999 | 17.3% | 10.9% | 8.5% |
| $25,000 to $34,999 | 8.7% | 10.5% | 8.6% |
| $35,000 to $49,999 | 11.8% | 13.2% | 12.0% |
| $50,000 to $74,999 | 16.2% | 17.5% | 17.2% |
| $75,000 to $99,999 | 10.7% | 11.8% | 12.8% |
| $100,000 to $149,999 | 8.3% | 13.1% | 15.6% |
| $150,000 to $199,999 | 2.7% | 4.9% | 7.1% |
| $200,000 or more | 1.7% | 4.4% | 8.3% |
Education
| Education | Sylacauga | Alabama | Country |
|---|---|---|---|
| < 9th Grade | 5% | 4% | 5.0% |
| 9-12th Grade | 11% | 9% | 7.0% |
| High School or GED | 30% | 30% | 27.0% |
| Other College | 29% | 22% | 20.0% |
| Associate's Degree | 9% | 9% | 9% |
| Bachelor's Degree | 10% | 16% | 20.0% |
| Master's Degree | 5% | 7% | 9.0% |
| Professional Degree | 1% | 2% | 2.0% |
| Doctorate Degree | 0% | 1% | 1.0% |
Household Income
Education
Race / Ethnicity
| Ethnicity | Sylacauga | Alabama | Country |
|---|---|---|---|
| White | 64.7% | 65.2% | 60.1% |
| African American | 29.5% | 26.4% | 12.2% |
| American Indian | 1% | 0.4% | 0.6% |
| Asian | 0% | 1.4% | 5.6% |
| Hawaiian | 0.8% | 0% | 0.2% |
| Other | 0.1% | 0.2% | 0.3% |
| Multiracial | 1.6% | 1.9% | 2.8% |
| Hispanic | 2.4% | 4.4% | 18.2% |
Race / Ethnicity
- ALABAMA
- ALASKA
- ARIZONA
- ARKANSAS
- CALIFORNIA
- COLORADO
- CONNECTICUT
- DELAWARE
- FLORIDA
- GEORGIA
- HAWAII
- IDAHO
- ILLINOIS
- INDIANA
- IOWA
- KANSAS
- KENTUCKY
- LOUISIANA
- MAINE
- MARYLAND
- MASSACHUSETTS
- MICHIGAN
- MINNESOTA
- MISSISSIPPI
- MISSOURI
- MONTANA
- NEBRASKA
- NEVADA
- NEW HAMPSHIRE
- NEW JERSEY
- NEW MEXICO
- NEW YORK
- NORTH CAROLINA
- NORTH DAKOTA
- OHIO
- OKLAHOMA
- OREGON
- PENNSYLVANIA
- RHODE ISLAND
- SOUTH CAROLINA
- SOUTH DAKOTA
- TENNESSEE
- TEXAS
- UTAH
- VERMONT
- VIRGINIA
- WASHINGTON
- WEST VIRGINIA
- WISCONSIN
- WYOMING
