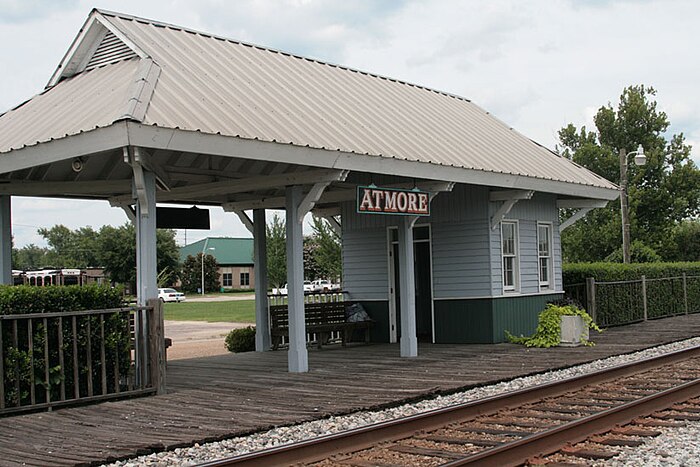
Moving to Atmore, Alabama
About Atmore, Alabama

Atmore is a city in Escambia County, Alabama, United States. The population was 8,391 at the 2020 census. It was incorporated on May 9, 1907.
The Atmore Commercial Historic District is listed on the National Register of Historic Places.
The Poarch Band of Creek Indians is headquartered in Atmore.
Gender
| Gender | Atmore | Alabama | Country |
|---|---|---|---|
| Female | 37.6% | 51.7% | 50.8% |
| Male | 62.4% | 48.3% | 49.2% |
Gender
Household Income
| Income | Atmore | Alabama | Country |
|---|---|---|---|
| Less than $10,000 | 29% | 8.1% | 5.8% |
| $10,000 to $14,999 | 8.7% | 5.6% | 4.1% |
| $15,000 to $24,999 | 12.1% | 10.9% | 8.5% |
| $25,000 to $34,999 | 18.2% | 10.5% | 8.6% |
| $35,000 to $49,999 | 9.1% | 13.2% | 12.0% |
| $50,000 to $74,999 | 10.9% | 17.5% | 17.2% |
| $75,000 to $99,999 | 5.2% | 11.8% | 12.8% |
| $100,000 to $149,999 | 4.1% | 13.1% | 15.6% |
| $150,000 to $199,999 | 1.6% | 4.9% | 7.1% |
| $200,000 or more | 1.1% | 4.4% | 8.3% |
Education
| Education | Atmore | Alabama | Country |
|---|---|---|---|
| < 9th Grade | 6% | 4% | 5.0% |
| 9-12th Grade | 24% | 9% | 7.0% |
| High School or GED | 46% | 30% | 27.0% |
| Other College | 12% | 22% | 20.0% |
| Associate's Degree | 3% | 9% | 9% |
| Bachelor's Degree | 6% | 16% | 20.0% |
| Master's Degree | 3% | 7% | 9.0% |
| Professional Degree | 0% | 2% | 2.0% |
| Doctorate Degree | 0% | 1% | 1.0% |
Household Income
Education
Race / Ethnicity
| Ethnicity | Atmore | Alabama | Country |
|---|---|---|---|
| White | 39.3% | 65.2% | 60.1% |
| African American | 57.2% | 26.4% | 12.2% |
| American Indian | 0.8% | 0.4% | 0.6% |
| Asian | 0.1% | 1.4% | 5.6% |
| Hawaiian | 0.5% | 0% | 0.2% |
| Other | 0% | 0.2% | 0.3% |
| Multiracial | 0.8% | 1.9% | 2.8% |
| Hispanic | 1.3% | 4.4% | 18.2% |
Race / Ethnicity
- ALABAMA
- ALASKA
- ARIZONA
- ARKANSAS
- CALIFORNIA
- COLORADO
- CONNECTICUT
- DELAWARE
- FLORIDA
- GEORGIA
- HAWAII
- IDAHO
- ILLINOIS
- INDIANA
- IOWA
- KANSAS
- KENTUCKY
- LOUISIANA
- MAINE
- MARYLAND
- MASSACHUSETTS
- MICHIGAN
- MINNESOTA
- MISSISSIPPI
- MISSOURI
- MONTANA
- NEBRASKA
- NEVADA
- NEW HAMPSHIRE
- NEW JERSEY
- NEW MEXICO
- NEW YORK
- NORTH CAROLINA
- NORTH DAKOTA
- OHIO
- OKLAHOMA
- OREGON
- PENNSYLVANIA
- RHODE ISLAND
- SOUTH CAROLINA
- SOUTH DAKOTA
- TENNESSEE
- TEXAS
- UTAH
- VERMONT
- VIRGINIA
- WASHINGTON
- WEST VIRGINIA
- WISCONSIN
- WYOMING
